Costco 2001 Annual Report Download - page 23
Download and view the complete annual report
Please find page 23 of the 2001 Costco annual report below. You can navigate through the pages in the report by either clicking on the pages listed below, or by using the keyword search tool below to find specific information within the annual report.-
 1
1 -
2
-
3
-
4
-
5
-
6
-
7
-
8
-
9
-
10
-
11
-
12
-
 13
13 -
 14
14 -
 15
15 -
 16
16 -
 17
17 -
 18
18 -
 19
19 -
 20
20 -
 21
21 -
 22
22 -
 23
23 -
 24
24 -
 25
25 -
 26
26 -
 27
27 -
 28
28 -
 29
29 -
 30
30 -
 31
31 -
 32
32 -
 33
33 -
34
-
35
-
36
-
37
-
38
-
39
-
40
-
41
-
42
-
43
-
44
 |
 |

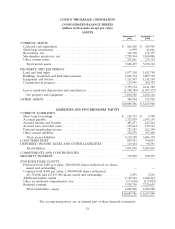
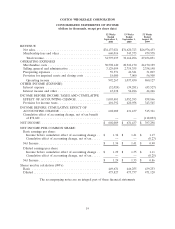
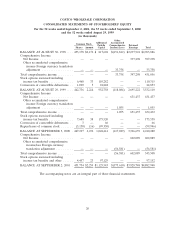
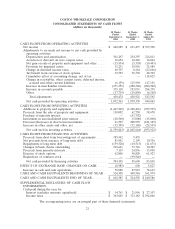
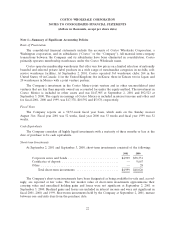
COSTCO WHOLESALE CORPORATION
CONSOLIDATED STATEMENTS OF CASH FLOWS
(dollars in thousands)
52 Weeks 53 Weeks 52 Weeks
Ended Ended Ended
September 2, September 3, August 29,
2001 2000 1999
CASH FLOWS FROM OPERATING ACTIVITIES
Net income ...................................... $ 602,089 $ 631,437 $ 397,298
Adjustments to reconcile net income to net cash provided by
operating activities:
Depreciation and amortization ....................... 301,297 254,397 224,811
Accretion of discount on zero coupon notes ............. 16,654 16,222 16,064
Net gain on sale of property and equipment and other ..... (15,934) (5,358) (10,443)
Provision for impaired assets ........................ 15,231 10,956 31,080
Change in deferred income taxes ..................... 40,797 8,264 (22,666)
Tax benefit from exercise of stock options .............. 32,552 76,730 48,392
Cumulative effect of accounting change, net of tax ........ — — 118,023
Change in receivables, other current assets, deferred income,
accrued and other current liabilities ................. (6,159) 115,909 147,136
Increase in merchandise inventories ................... (271,355) (280,380) (286,902)
Increase in accounts payable ........................ 335,110 253,031 284,238
Other ......................................... (17,719) (10,850) (6,168)
Total adjustments .............................. 430,474 438,921 543,565
Net cash provided by operating activities ............... 1,032,563 1,070,358 940,863
CASH FLOWS FROM INVESTING ACTIVITIES
Additions to property and equipment ................... (1,447,549) (1,228,421) (787,935)
Proceeds from the sale of property and equipment .......... 110,002 62,730 58,670
Purchase of minority interest ......................... — (51,792) —
Investment in unconsolidated joint venture ............... (28,500) (5,000) (15,000)
Decrease/(Increase) in short-term investments ............. 41,599 208,959 (181,103)
Increase in other assets and other, net .................. (15,395) (32,140) (28,555)
Net cash used in investing activities ................... (1,339,843) (1,045,664) (953,923)
CASH FLOWS FROM FINANCING ACTIVITIES
Proceeds from short-term borrowings net of repayments ...... 185,942 9,435 —
Net proceeds from issuance of long-term debt ............. 81,951 2,199 10,336
Repayments of long-term debt ........................ (159,328) (10,513) (11,675)
Changes in bank checks outstanding .................... 216,661 33,746 10,203
Proceeds from minority interests ....................... 7,119 24,856 15,058
Exercise of stock options ............................ 62,000 98,828 61,923
Repurchase of common stock ......................... — (99,946) —
Net cash provided by financing activities ............... 394,345 58,605 85,845
EFFECT OF EXCHANGE RATE CHANGES ON CASH ..... (8,985) 620 5,827
Increase in cash and cash equivalents ................... 78,080 83,919 78,612
CASH AND CASH EQUIVALENTS BEGINNING OF YEAR . 524,505 440,586 361,974
CASH AND CASH EQUIVALENTS END OF YEAR ........ $ 602,585 $ 524,505 $ 440,586
SUPPLEMENTAL DISCLOSURE OF CASH FLOW
INFORMATION:
Cash paid during the year for:
Interest (excludes amounts capitalized) ................ $ 14,761 $ 21,996 $ 27,107
Income taxes ................................... $ 363,649 $ 313,183 $ 294,860
The accompanying notes are an integral part of these financial statements.
21