Costco 2001 Annual Report Download - page 12
Download and view the complete annual report
Please find page 12 of the 2001 Costco annual report below. You can navigate through the pages in the report by either clicking on the pages listed below, or by using the keyword search tool below to find specific information within the annual report.-
 1
1 -
 2
2 -
 3
3 -
 4
4 -
 5
5 -
 6
6 -
 7
7 -
 8
8 -
 9
9 -
 10
10 -
 11
11 -
 12
12 -
 13
13 -
 14
14 -
 15
15 -
 16
16 -
 17
17 -
 18
18 -
 19
19 -
 20
20 -
 21
21 -
 22
22 -
23
-
24
-
25
-
26
-
27
-
28
-
29
-
30
-
31
-
32
-
33
-
34
-
35
-
36
-
37
-
38
-
39
-
40
-
41
-
42
-
43
-
44
 |
 |
MANAGEMENT’S DISCUSSION AND ANALYSIS OF FINANCIAL CONDITION
AND RESULTS OF OPERATIONS
Certain statements contained in this document constitute forward-looking statements within the
meaning of the Private Securities Litigation Reform Act of 1995. For these purposes, forward-looking
statements are statements that address activities, events, conditions or developments that the Company
expects or anticipates may occur in the future. Such forward-looking statements involve risks and
uncertainties that may cause actual events, results or performance to differ materially from those indicated
by such statements. These risks and uncertainties include, but are not limited to, domestic and interna-
tional economic conditions including exchange rates, the effects of competition and regulation, conditions
affecting the acquisition, development, ownership or use of real estate, actions of vendors, and other risks
identified from time to time in the Company’s public statements and reports filed with the SEC.
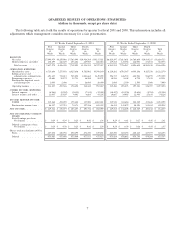
Comparison of Fiscal 2001 (52 weeks) and Fiscal 2000 (53 weeks):
(dollars in thousands, except earnings per share)
Net income for fiscal 2001, a 52-week fiscal year, decreased 5% to $602,089, or $1.29 per diluted
share, from $631,437, or $1.35 per diluted share during fiscal year 2000, a 53-week fiscal year.
Net sales increased 8% to $34,137,021 in fiscal 2001 from $31,620,723 in fiscal 2000. This increase was
due to higher sales at existing locations opened prior to fiscal 2000; increased sales at 21 warehouses (25
opened, 4 closed) that were opened in fiscal 2000 and in operation for the entire 2001 fiscal year; and first
year sales at the 32 new warehouses opened (39 opened, 7 closed) during fiscal 2001. Changes in prices did
not materially impact sales levels.
Comparable sales, that is sales in warehouses open for at least a year, increased at a 4% annual rate in
fiscal 2001 compared to an 11% annual rate during fiscal 2000.
Membership fees and other revenue increased 21% to $660,016, or 1.93% of net sales, in fiscal 2001
from $543,573, or 1.72% of net sales, in fiscal 2000. This increase was primarily due to the increase in
membership fees across most membership categories, averaging approximately $5 per member, which
became effective beginning with renewals on October 1, 2000. Additionally, membership sign-ups at the 32
new warehouses opened in fiscal 2001 were also a factor in this increase.
Gross margin (defined as net sales minus merchandise costs) increased 7% to $3,538,881, or 10.37%
of net sales, in fiscal 2001 from $3,298,553, or 10.43% of net sales, in fiscal 2000. Gross margin as a
percentage of net sales decreased by six basis points due to costs related to the Executive Membership two
percent reward program, which was somewhat offset by gross margin improvement in the Company’s core
merchandising activities and ancillary operations. The gross margin figures reflect accounting for most U.S.
merchandise inventories on the last-in, first-out (LIFO) method. If all inventories had been valued using
the first-in, first-out (FIFO) method, inventories would have been higher by $13,650 at September 2, 2001,
and $8,150 at September 3, 2000.
Selling, general and administrative expenses as a percent of net sales increased to 9.17% during fiscal
2001 from 8.71% during fiscal 2000, due to a number of a factors, including an increase in the entry level
wage rate of hourly employees beginning in the fourth quarter of fiscal 2000; continued expansion of the
Company’s co-branded credit card program; higher utility and energy costs; and higher expenses associated
with an increase in new warehouse openings year-over-year (a net of 32 and 21 warehouses opened in fiscal
2001 and 2000, respectively) where expense ratios to sales are typically higher than in more mature
warehouses.
Preopening expenses totaled $59,571, or 0.17% of net sales, during fiscal 2001 and $42,321, or 0.13%
of net sales, during fiscal 2000. During fiscal 2001, the Company opened 39 new warehouses (including
relocations) compared to 25 new warehouses (including relocations) during fiscal 2000. Pre-opening
10