Costco 2001 Annual Report Download - page 10
Download and view the complete annual report
Please find page 10 of the 2001 Costco annual report below. You can navigate through the pages in the report by either clicking on the pages listed below, or by using the keyword search tool below to find specific information within the annual report.-
 1
1 -
 2
2 -
 3
3 -
 4
4 -
 5
5 -
 6
6 -
 7
7 -
 8
8 -
 9
9 -
 10
10 -
 11
11 -
 12
12 -
 13
13 -
 14
14 -
 15
15 -
 16
16 -
 17
17 -
 18
18 -
 19
19 -
 20
20 -
 21
21 -
22
-
23
-
24
-
25
-
26
-
27
-
28
-
29
-
30
-
31
-
32
-
33
-
34
-
35
-
36
-
37
-
38
-
39
-
40
-
41
-
42
-
43
-
44
 |
 |

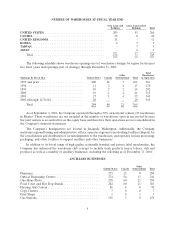
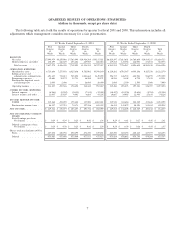
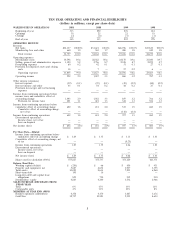
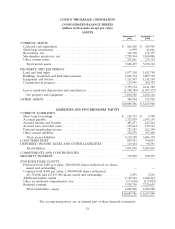
TEN YEAR OPERATING AND FINANCIAL HIGHLIGHTS
(dollars in millions, except per share data)
2001 2000 1999 1998WAREHOUSES IN OPERATIONS
Beginning of year 313 292 278 261
Openings 39 25 21 18
Closings (7) (4) (7) (1)
End of year 345 313 292 278
OPERATING RESULTS
Revenue
Net Sales $34,137 100.00% $31,621 100.0% $26,976 100.0% $23,830 100.0%
Membership fees and other 660 1.9 543 1.7 480 1.8 440 1.8
Total revenue 34,797 101.9 32,164 101.7 27,456 101.8 24,270 101.8
Operating expenses
Merchandise costs 30,598 89.6 28,322 89.6 24,170 89.6 21,380 89.7
Selling, general and administrative expenses 3,129 9.2 2,756 8.7 2,338 8.7 2,070 8.7
Preopening expenses 60 0.2 42 0.1 31 0.1 27 0.1
Provision for impaired assets and closing
costs 18 — 7 — 57 0.2 6 —
Operating expenses 33,805 99.0 31,127 98.4 26,596 98.6 23,483 98.5
Operating income 992 2.9 1,037 3.3 860 3.2 787 3.3
Other income (expenses)
Interest expense (32) (0.1) (39) (0.1) (45) (0.2) (48) (0.2)
Interest income and other 43 0.1 54 0.2 44 0.2 27 0.1
Provision for merger and restructuring
expenses — — — — — — — —
Income from continuing operations before
income taxes and cumulative effect of
accounting change 1,003 2.9 1,052 3.3 859 3.2 766 3.2
Provision for income taxes 401 1.1 421 1.3 344 1.3 306 1.3
Income from continuing operations before
cumulative effect of accounting change 602 1.8 631 2.0 515 1.9 460 1.9
Cumulative effect of accounting change,
net of tax — — — — (118) (0.4) — —
Income from continuing operations 602 1.8 631 2.0 397 1.5 460 1.9
Discontinued operations:
Income (loss), net of tax — — — — — — — —
Loss on disposal — — — — — — — —
Net income (loss) $ 602 1.8% $ 631 2.0% $ 397 1.5% $ 460 1.9%
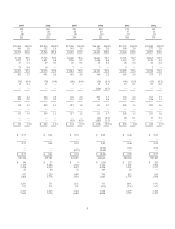
Per Share Data—Diluted
Income from continuing operations before
cumulative effect of accounting change $ 1.29 $ 1.35 $ 1.11 $ 1.01
Cumulative effect of accounting change, net
of tax — — (0.25) —
Income from continuing operations 1.29 1.35 0.86 1.01
Discontinued operations:
Income (loss), net of tax ————
Loss on disposal ————
Net income (loss) $ 1.29 $ 1.35 $ 0.86 $ 1.01
Shares used in calculation (000’s) 475,827 475,737 471,120 463,371
Balance Sheet Data
Working capital (deficit) $ (230) $ 66 $ 450 $ 431
Property and equipment, net 5,827 4,834 3,907 3,395
Total assets 10,090 8,634 7,505 6,260
Short-term debt 195 10 — —
Long-term debt and capital lease
obligations 859 790 919 930
Stockholders’ equity 4,883 4,240 3,532 2,966
SALES INCREASE (DECREASE) FROM
PRIOR YEAR
Total 8% 17% 13% 11%
Comparable units 4% 11% 10% 8%
MEMBERS AT YEAR END (000’S)
Business (primary cardholders) 4,358 4,170 3,887 3,676
Gold Star 12,737 10,521 9,555 8,654
8