Columbia Sportswear 2010 Annual Report Download - page 69
Download and view the complete annual report
Please find page 69 of the 2010 Columbia Sportswear annual report below. You can navigate through the pages in the report by either clicking on the pages listed below, or by using the keyword search tool below to find specific information within the annual report.-
 1
1 -
2
-
3
-
4
-
5
-
6
-
7
-
8
-
9
-
10
-
11
-
12
-
13
-
14
-
15
-
16
-
17
-
18
-
19
-
20
-
21
-
22
-
23
-
24
-
25
-
26
-
27
-
28
-
29
-
30
-
31
-
32
-
33
-
34
-
35
-
36
-
37
-
38
-
39
-
40
-
41
-
42
-
43
-
44
-
45
-
46
-
47
-
48
-
49
-
50
-
51
-
52
-
53
-
54
-
55
-
56
-
57
-
58
-
 59
59 -
 60
60 -
 61
61 -
 62
62 -
 63
63 -
 64
64 -
 65
65 -
 66
66 -
 67
67 -
 68
68 -
 69
69 -
 70
70 -
 71
71 -
 72
72 -
 73
73 -
 74
74 -
 75
75 -
 76
76 -
 77
77 -
 78
78 -
 79
79 -
80
-
81
-
82
-
83
-
84
-
85
-
86
-
87
 |
 |

COLUMBIA SPORTSWEAR COMPANY
NOTES TO CONSOLIDATED FINANCIAL STATEMENTS—(Continued)
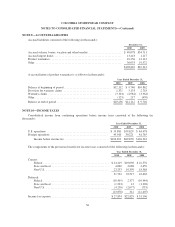
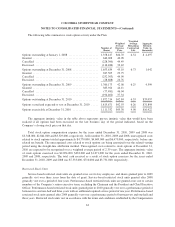
The following table summarizes stock option activity under the Plan:
Number of
Shares
Weighted
Average
Exercise
Price
Weighted
Average
Remaining
Contractual
Life
Aggregate
Intrinsic
Value (in
thousands)
Options outstanding at January 1, 2008 ..................... 1,358,417 $46.70 6.54 $ 4,497
Granted .............................................. 640,008 40.98
Cancelled ............................................ (228,300) 49.49
Exercised ............................................. (116,486) 32.42
Options outstanding at December 31, 2008 .................. 1,653,639 45.10 6.73 1,042
Granted .............................................. 387,505 29.75
Cancelled ............................................ (252,303) 44.90
Exercised ............................................. (28,668) 24.76
Options outstanding at December 31, 2009 .................. 1,760,173 42.08 6.25 4,599
Granted .............................................. 385,924 44.11
Cancelled ............................................ (77,481) 46.04
Exercised ............................................. (196,402) 37.34
Options outstanding at December 31, 2010 .................. 1,872,214 $42.84 6.33 $33,057
Options vested and expected to vest at December 31, 2010 ..... 1,815,671 $42.93 6.26 $31,898
Options exercisable at December 31, 2010 .................. 1,111,332 $45.38 4.98 $16,922
The aggregate intrinsic value in the table above represents pre-tax intrinsic value that would have been
realized if all options had been exercised on the last business day of the period indicated, based on the
Company’s closing stock price on that day.
Total stock option compensation expense for the years ended December 31, 2010, 2009 and 2008 was
$3,348,000, $2,861,000 and $3,329,000, respectively. At December 31, 2010, 2009 and 2008, unrecognized costs
related to stock options totaled approximately $4,770,000, $4,609,000 and $6,473,000, respectively, before any
related tax benefit. The unrecognized costs related to stock options are being amortized over the related vesting
period using the straight-line attribution method. Unrecognized costs related to stock options at December 31,
2010 are expected to be recognized over a weighted average period of 2.39 years. The aggregate intrinsic value
of stock options exercised was $2,854,000, $333,000 and $1,071,000 for the years ended December 31, 2010,
2009 and 2008, respectively. The total cash received as a result of stock option exercises for the years ended
December 31, 2010, 2009 and 2008 was $7,333,000, $710,000 and $3,731,000, respectively.
Restricted Stock Units
Service-based restricted stock units are granted at no cost to key employees, and shares granted prior to 2009
generally vest over three years from the date of grant. Service-based restricted stock units granted after 2008
generally vest over a period of four years. Performance-based restricted stock units are granted at no cost to certain
members of the Company’s senior executive team, excluding the Chairman and the President and Chief Executive
Officer. Performance-based restricted stock units granted prior to 2010 generally vest over a performance period of
between two and one-half and three years with an additional required service period of one year. Performance-based
restricted stock units granted after 2009 generally vest over a performance period of between two and one-half and
three years. Restricted stock units vest in accordance with the terms and conditions established by the Compensation
63