Columbia Sportswear 2010 Annual Report Download - page 36
Download and view the complete annual report
Please find page 36 of the 2010 Columbia Sportswear annual report below. You can navigate through the pages in the report by either clicking on the pages listed below, or by using the keyword search tool below to find specific information within the annual report.-
 1
1 -
2
-
3
-
4
-
5
-
6
-
7
-
8
-
9
-
10
-
11
-
12
-
13
-
14
-
15
-
16
-
17
-
18
-
19
-
20
-
21
-
22
-
23
-
24
-
25
-
 26
26 -
 27
27 -
 28
28 -
 29
29 -
 30
30 -
 31
31 -
 32
32 -
 33
33 -
 34
34 -
 35
35 -
 36
36 -
 37
37 -
 38
38 -
 39
39 -
 40
40 -
 41
41 -
 42
42 -
 43
43 -
 44
44 -
 45
45 -
 46
46 -
47
-
48
-
49
-
50
-
51
-
52
-
53
-
54
-
55
-
56
-
57
-
58
-
59
-
60
-
61
-
62
-
63
-
64
-
65
-
66
-
67
-
68
-
69
-
70
-
71
-
72
-
73
-
74
-
75
-
76
-
77
-
78
-
79
-
80
-
81
-
82
-
83
-
84
-
85
-
86
-
87
 |
 |

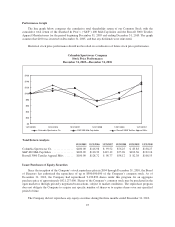
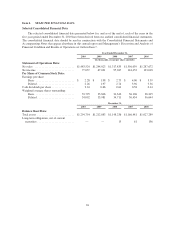
The following table sets forth, for the periods indicated, the percentage relationship to net sales of specified
items in our Consolidated Statements of Operations:
2010 2009 2008
Net sales ........................................................ 100.0% 100.0% 100.0%
Cost of sales ..................................................... 57.6 57.9 56.9
Gross profit ...................................................... 42.4 42.1 43.1
Selling, general and administrative expense ............................ 36.0 35.7 32.7
Impairment of acquired intangible assets ............................... — — 1.9
Net licensing income .............................................. 0.6 0.7 0.5
Income from operations ............................................ 7.0 7.1 9.0
Interest income, net ............................................... 0.1 0.1 0.6
Income before income tax .......................................... 7.1 7.2 9.6
Income tax expense ............................................... (1.9) (1.8) (2.4)
Net income ...................................................... 5.2% 5.4% 7.2%
Year Ended December 31, 2010 Compared to Year Ended December 31, 2009
Net Sales: Consolidated net sales increased $239.5 million, or 19%, to $1,483.5 million in 2010 from
$1,244.0 million in 2009. Net sales increased across all geographic regions, in each product category and across
all major brands. Changes in foreign currency exchange rates compared with 2009 contributed approximately one
percentage point of benefit to the consolidated net sales comparison.
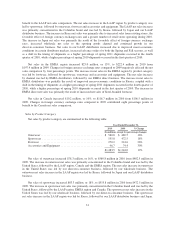
Sales by Geographic Region
Net sales by geographic region are summarized in the following table:
Year Ended December 31,
2010 2009 % Change
(In millions, except for percentage changes)
United States ........................................ $ 881.0 $ 736.9 20%
LAAP .............................................. 263.4 203.2 30%
EMEA ............................................. 222.4 197.4 13%
Canada ............................................. 116.7 106.5 10%
$1,483.5 $1,244.0 19%
Net sales in the United States increased $144.1 million, or 20%, to $881.0 million in 2010 from
$736.9 million in 2009. The increase in net sales in the United States by product category was led by outerwear,
followed by sportswear, footwear and accessories and equipment. The net sales increase by channel was led by
our wholesale business, followed by our direct-to-consumer business. The increase in net sales in our wholesale
business was primarily concentrated in the Columbia brand resulting from improved economic conditions
compared to the same period in 2009 and stronger advance orders. The net sales increase in our
direct-to-consumer business was primarily concentrated in the Columbia brand and was driven by increased sales
within existing stores, increased sales through our Columbia and Sorel brand e-commerce sites, which were
launched in the third and fourth quarter of 2009, respectively, incremental sales from our Mountain Hardwear
brand e-commerce site which was launched in the third quarter of 2010, and an increase in the number of retail
stores, with 4 more retail stores operating at December 31, 2010 than at December 31, 2009.
Net sales in the LAAP region increased $60.2 million, or 30%, to $263.4 million in 2010 from
$203.2 million in 2009. Changes in foreign currency exchange rates contributed seven percentage points of
30