Columbia Sportswear 2010 Annual Report Download - page 39
Download and view the complete annual report
Please find page 39 of the 2010 Columbia Sportswear annual report below. You can navigate through the pages in the report by either clicking on the pages listed below, or by using the keyword search tool below to find specific information within the annual report.-
 1
1 -
2
-
3
-
4
-
5
-
6
-
7
-
8
-
9
-
10
-
11
-
12
-
13
-
14
-
15
-
16
-
17
-
18
-
19
-
20
-
21
-
22
-
23
-
24
-
25
-
26
-
27
-
28
-
 29
29 -
 30
30 -
 31
31 -
 32
32 -
 33
33 -
 34
34 -
 35
35 -
 36
36 -
 37
37 -
 38
38 -
 39
39 -
 40
40 -
 41
41 -
 42
42 -
 43
43 -
 44
44 -
 45
45 -
 46
46 -
 47
47 -
 48
48 -
 49
49 -
50
-
51
-
52
-
53
-
54
-
55
-
56
-
57
-
58
-
59
-
60
-
61
-
62
-
63
-
64
-
65
-
66
-
67
-
68
-
69
-
70
-
71
-
72
-
73
-
74
-
75
-
76
-
77
-
78
-
79
-
80
-
81
-
82
-
83
-
84
-
85
-
86
-
87
 |
 |

initiatives, reinstatement of personnel and benefit programs that were curtailed or postponed in 2009,
and higher incentive compensation;
• Incremental expenses to support our expanded direct-to-consumer businesses in the United States, the
EMEA region and Canada;
• Expenses associated with various initiatives to improve our information technology infrastructure,
including increased costs associated with our multi-year global ERP implementation; and
• Increased advertising expense.
As a percentage of net sales, SG&A expense increased to 36.0% of net sales in 2010 from 35.7% of net
sales in 2009. Depreciation and amortization included in SG&A expense totaled $37.8 million in 2010 compared
to $35.5 million in 2009.
Net Licensing Income: Net licensing income decreased $0.4 million, or 5%, to $8.0 million in 2010 from
$8.4 million in 2009.
Interest Income, Net: Net interest income was $1.6 million in 2010 compared to $2.1 million in 2009.
The decrease in interest income was primarily driven by lower interest rates in 2010 compared to 2009. Interest
expense was nominal in both 2010 and 2009.
Income Tax Expense: Income tax expense increased to $27.9 million in 2010 from $22.8 million in 2009.
This increase resulted from higher income before tax as well as an increase in our effective income tax rate to
26.6% in 2010 compared to 25.4% in 2009. Our effective tax rates in 2010 and 2009 were reduced by the
recognition of tax benefits associated with the favorable resolution of uncertain tax positions, foreign tax credits
and non-U.S. income generally taxed at lower tax rates.
Net Income: Net income increased $10.0 million, or 15%, to $77.0 million in 2010 from $67.0 in 2009.
Diluted earnings per share was $2.26 in 2010 compared to $1.97 in 2009.
Year Ended December 31, 2009 Compared to Year Ended December 31, 2008
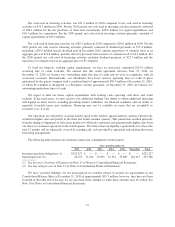
Net Sales: Consolidated net sales decreased $73.8 million, or 6%, to $1,244.0 million in 2009 from
$1,317.8 million in 2008. Changes in foreign currency exchange rates compared with 2008 negatively affected
the consolidated net sales comparison by approximately one percentage point. The decrease in net sales was led
by the EMEA region and Canada, partially offset by increased net sales in the United States and the LAAP
region. By product category, the reduction in net sales was led by sportswear, followed by outerwear and
footwear, partially offset by increased net sales of accessories and equipment.
Sales by Geographic Region
Year Ended December 31,
2009 2008 % Change
(In millions, except for percentage changes)
United States ........................................ $ 736.9 $ 727.7 1%
LAAP .............................................. 203.2 198.2 3%
EMEA ............................................. 197.4 267.2 (26)%
Canada ............................................. 106.5 124.7 (15)%
$1,244.0 $1,317.8 (6)%
Net sales in the United States increased $9.2 million, or 1%, to $736.9 million in 2009 from $727.7 million
in 2008. The increase in net sales in the United States was led by outerwear, followed by footwear and
33