Columbia Sportswear 2010 Annual Report Download - page 38
Download and view the complete annual report
Please find page 38 of the 2010 Columbia Sportswear annual report below. You can navigate through the pages in the report by either clicking on the pages listed below, or by using the keyword search tool below to find specific information within the annual report.-
 1
1 -
2
-
3
-
4
-
5
-
6
-
7
-
8
-
9
-
10
-
11
-
12
-
13
-
14
-
15
-
16
-
17
-
18
-
19
-
20
-
21
-
22
-
23
-
24
-
25
-
26
-
27
-
 28
28 -
 29
29 -
 30
30 -
 31
31 -
 32
32 -
 33
33 -
 34
34 -
 35
35 -
 36
36 -
 37
37 -
 38
38 -
 39
39 -
 40
40 -
 41
41 -
 42
42 -
 43
43 -
 44
44 -
 45
45 -
 46
46 -
 47
47 -
 48
48 -
49
-
50
-
51
-
52
-
53
-
54
-
55
-
56
-
57
-
58
-
59
-
60
-
61
-
62
-
63
-
64
-
65
-
66
-
67
-
68
-
69
-
70
-
71
-
72
-
73
-
74
-
75
-
76
-
77
-
78
-
79
-
80
-
81
-
82
-
83
-
84
-
85
-
86
-
87
 |
 |

The sportswear net sales increase in the EMEA region was led by our EMEA distributor business, partially offset
by decreased net sales in our EMEA direct business.
Net sales of footwear increased $55.6 million, or 26%, to $270.2 million in 2010 from $214.6 million in
2009. The increase in footwear net sales by brand was led by the Sorel brand, followed by the Columbia brand.
The footwear net sales increase by region was led by the United States, followed by the EMEA region, the LAAP
region and Canada. The net sales increase in footwear in the United States was led by our wholesale business,
followed by our direct-to-consumer business. The footwear net sales increase in the EMEA region was led by our
EMEA direct business, followed by our EMEA distributor business. The LAAP footwear net sales increase was
led by our LAAP distributor business, followed by Korea and Japan.
Net sales of accessories and equipment increased $22.3 million, or 30%, to $96.7 million in 2010 from
$74.4 million in 2009. The accessories and equipment net sales increase was primarily concentrated in the
Columbia brand, followed by the Mountain Hardwear brand. Accessories and equipment net sales growth by
region was led by the United States, followed by the LAAP region, the EMEA region and Canada.
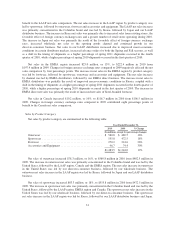
Sales by Brand
Net sales by brand are summarized in the following table:
Year Ended December 31,
2010 2009 % Change
(In millions, except for percentage changes)
Columbia ........................................... $1,262.4 $1,072.5 18%
Mountain Hardwear ................................... 121.9 100.5 21%
Sorel ............................................... 89.7 60.6 48%
Other .............................................. 9.5 10.4 (9)%
$1,483.5 $1,244.0 19%
The net sales increase by brand in 2010 compared to 2009 was primarily concentrated in the Columbia
brand, followed by the Sorel and Mountain Hardwear brands. The Columbia brand net sales increased across all
product categories, led by sportswear, followed by outerwear, footwear and accessories and equipment. The
Columbia brand net sales increased across all regions led by the United States, followed by the LAAP region, the
EMEA region and Canada.
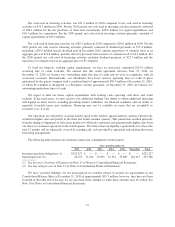
Gross Profit: Gross profit as a percentage of net sales increased to 42.4% in 2010 from 42.1% in 2009.
Gross profit margins expanded primarily due to a higher volume of direct-to-consumer sales at higher gross
margins, improved gross margins on close-out product sales and favorable foreign currency hedge rates, largely
offset by increased costs to expedite production and delivery of fall 2010 orders to wholesale customers.
Our gross profit may not be comparable to those of other companies in our industry because some include
all of the costs related to their distribution network in cost of sales. We, like others, have chosen to include these
expenses as a component of selling, general and administrative expense.
Selling, General and Administrative Expense: Selling, general and administrative expense (“SG&A”)
includes all costs associated with our design, merchandising, marketing, selling, distribution and corporate
functions, including related depreciation and amortization.
SG&A expense increased $89.4 million, or 20%, to $534.1 million in 2010 from $444.7 million in 2009.
The SG&A expense increase was primarily due to:
• Increased global personnel costs resulting from the continued internalization of our sales organization
in the United States, the EMEA region and Canada, additional personnel to support our growth
32