Columbia Sportswear 2010 Annual Report Download - page 41
Download and view the complete annual report
Please find page 41 of the 2010 Columbia Sportswear annual report below. You can navigate through the pages in the report by either clicking on the pages listed below, or by using the keyword search tool below to find specific information within the annual report.-
 1
1 -
2
-
3
-
4
-
5
-
6
-
7
-
8
-
9
-
10
-
11
-
12
-
13
-
14
-
15
-
16
-
17
-
18
-
19
-
20
-
21
-
22
-
23
-
24
-
25
-
26
-
27
-
28
-
29
-
30
-
 31
31 -
 32
32 -
 33
33 -
 34
34 -
 35
35 -
 36
36 -
 37
37 -
 38
38 -
 39
39 -
 40
40 -
 41
41 -
 42
42 -
 43
43 -
 44
44 -
 45
45 -
 46
46 -
 47
47 -
 48
48 -
 49
49 -
 50
50 -
 51
51 -
52
-
53
-
54
-
55
-
56
-
57
-
58
-
59
-
60
-
61
-
62
-
63
-
64
-
65
-
66
-
67
-
68
-
69
-
70
-
71
-
72
-
73
-
74
-
75
-
76
-
77
-
78
-
79
-
80
-
81
-
82
-
83
-
84
-
85
-
86
-
87
 |
 |

Net sales of sportswear decreased $68.4 million, or 13%, to $472.5 million in 2009 from $540.9 million in
2008. The decrease in sportswear net sales consisted of decreased net sales in the United States wholesale
business, the EMEA direct and distributor businesses, Canada and the LAAP distributor business, partially offset
by increased net sales in our United States retail business, Japan and Korea. By brand, the decrease in net sales of
Columbia-branded sportswear was partially offset by increased net sales of Mountain Hardwear-branded
sportswear. We primarily attribute the decrease in wholesale net sales of Columbia-branded sportswear to lower
initial order volumes.
Net sales of footwear decreased $2.6 million, or 1%, to $214.6 million in 2009 from $217.2 million in 2008.
The decrease in footwear net sales was concentrated in the EMEA distributor business, followed by the United
States wholesale and LAAP distributor businesses, partially offset by increased net sales of footwear in our
United States retail business, Japan and Canada. Footwear net sales were essentially flat in the EMEA direct
business and Korea. By brand, the decrease in net sales of Columbia-branded footwear was partially offset by
increased net sales of Sorel-branded footwear. Net sales of Sorel-branded footwear increased in all regions and
businesses except the EMEA distributor business. The decrease in footwear net sales to EMEA distributors
primarily reflects lower Columbia-branded product net sales to our largest customer in that region and a shift in
the timing of shipments as a smaller percentage of spring 2010 shipments occurred in the fourth quarter of 2009,
while a higher percentage of spring 2009 shipments occurred in the fourth quarter of 2008.
Net sales of accessories and equipment increased $6.4 million, or 9%, to $74.4 million in 2009 from
$68.0 million in 2008. Accessories and equipment sales growth was concentrated in Columbia-branded
accessories and equipment and led by the United States and the LAAP region, followed by Canada, partially
offset by a decrease in net sales in the EMEA region.
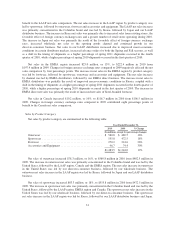
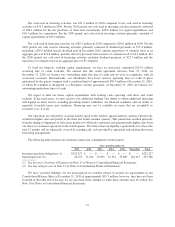
Sales by Brand
Year Ended December 31,
2009 2008 % Change
(In millions, except for percentage changes)
Columbia ........................................... $1,072.5 $1,162.0 (8)%
Mountain Hardwear ................................... 100.5 95.0 6%
Sorel ............................................... 60.6 48.1 26%
Other .............................................. 10.4 12.7 (18)%
$1,244.0 $1,317.8 (6)%
Gross Profit: Gross profit as a percentage of net sales decreased to 42.1% in 2009 from 43.1% in 2008.
Gross profit margins contracted primarily as a result of a higher volume of close-out product sales at lower gross
margins and unfavorable hedge rates.
Selling, General and Administrative Expense: SG&A expense increased $14.3 million, or 3%, to
$444.7 million in 2009 from $430.4 million in 2008. As a percentage of net sales, SG&A expense increased to
35.7% of net sales in 2009 from 32.7% of net sales in 2008. The increase in SG&A expense as a percentage of
net sales was largely the result of reduced net sales in our wholesale business coupled with an increased fixed
cost base related to our expanding direct-to-consumer operations and increased incentive compensation and
professional fees, partially offset by reduced advertising and bad debt expense.
Selling expenses, including commissions and advertising, decreased $17.0 million, or 14%, to 8.4% of net
sales in 2009 from 9.2% of net sales in 2008. We attribute the decrease in selling expenses as a percentage of net
sales to lower commission expense as relationships with certain independent sales agencies in the United States
and the EMEA region have been discontinued and replaced by in-house sales operations. Operating expenses for
the in-house sales organization are included in general and administrative expenses.
35