Cincinnati Bell 2010 Annual Report Download - page 50
Download and view the complete annual report
Please find page 50 of the 2010 Cincinnati Bell annual report below. You can navigate through the pages in the report by either clicking on the pages listed below, or by using the keyword search tool below to find specific information within the annual report.-
 1
1 -
2
-
3
-
4
-
5
-
6
-
7
-
8
-
9
-
10
-
11
-
12
-
13
-
14
-
15
-
16
-
17
-
18
-
19
-
20
-
21
-
22
-
23
-
24
-
25
-
26
-
27
-
28
-
29
-
30
-
31
-
32
-
33
-
34
-
35
-
36
-
37
-
38
-
39
-
 40
40 -
 41
41 -
 42
42 -
 43
43 -
 44
44 -
 45
45 -
 46
46 -
 47
47 -
 48
48 -
 49
49 -
 50
50 -
 51
51 -
 52
52 -
 53
53 -
 54
54 -
 55
55 -
 56
56 -
 57
57 -
 58
58 -
 59
59 -
 60
60 -
61
-
62
-
63
-
64
-
65
-
66
-
67
-
68
-
69
-
70
-
71
-
72
-
73
-
74
-
75
-
76
-
77
-
78
-
79
-
80
-
81
-
82
-
83
-
84
-
85
-
86
-
87
-
88
-
89
-
90
-
91
-
92
-
93
-
94
-
95
-
96
-
97
-
98
-
99
-
100
-
101
-
102
-
103
-
104
-
105
-
106
-
107
-
108
-
109
-
110
-
111
-
112
-
113
-
114
-
115
-
116
-
117
-
118
-
119
-
120
-
121
-
122
-
123
-
124
-
125
-
126
-
127
-
128
-
129
-
130
-
131
-
132
-
133
-
134
-
135
-
136
-
137
-
138
-
139
-
140
-
141
-
142
-
143
-
144
-
145
-
146
-
147
-
148
-
149
-
150
-
151
-
152
-
153
-
154
-
155
-
156
-
157
-
158
-
159
-
160
-
161
-
162
-
163
-
164
-
165
-
166
-
167
-
168
-
169
-
170
-
171
-
172
-
173
-
174
-
175
-
176
-
177
-
178
-
179
-
180
-
181
-
182
-
183
-
184
-
185
-
186
-
187
-
188
-
189
-
190
-
191
-
192
-
193
-
194
-
195
-
196
-
197
-
198
-
199
-
200
-
201
-
202
-
203
-
204
-
205
-
206
-
207
-
208
-
209
-
210
-
211
-
212
-
213
-
214
-
215
-
216
 |
 |

Generally, no one factor is given more weight than another, nor does the Company use a formulaic approach in
setting executive pay. Additionally, the Company does not look at total compensation of the peer group. Instead,
the various factors are considered as a whole in determining executive pay adjustments.
For all executive officers other than himself, the Chief Executive Officer recommends base salaries, which
the Compensation Committee takes into consideration when making its determinations.
Similarly, the Company’s Chairman of the Board solicits input from each of the other directors regarding
the Chief Executive Officer’s performance during the year. In executive session, the Chairman of the Board
provides the Compensation Committee with a summary of the input received for further discussion. The
Compensation Committee’s independent consultant reviews the annual executive compensation study for the
Chief Executive Officer’s position. Based on these factors, the Compensation Committee determines the
adjustments in the Chief Executive Officer’s base salary to recommend for approval by the full Board.
Annual Incentive
Payments under the Company’s annual incentive plan are tied to:
•the Company’s level of achievement of (a) earnings before interest, taxes, depreciation and amortization
(“EBITDA”) and (b) revenues, and
•the executive’s individual performance.
The Company has selected the EBITDA and revenue measures because it believes that investors use them to
evaluate the financial performance of the Company and because they also indicate the level of success of the
Company’s strategy to sustain operating cash flows and profitability to drive transformative growth through its
data center strategy to become a premier data center colocation provider to the Fortune 1000 companies.
EBITDA is a common measure of profitability employed in the telecommunications and other capital-intensive
industries. The Compensation Committee and the Board review and approve the calculations of EBITDA and
revenues. In conjunction with such review, they may adjust the calculated result or goal amount to reflect a
change in business direction, reallocation of Company resources or an unanticipated event.
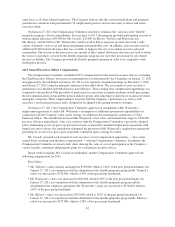
For 2010, the Compensation Committee generally allocated the annual incentive targets as follows:
•60% for attainment of the EBITDA goal
•20% for attainment of the revenue goal
•20% for individual performance
The EBITDA and revenue goals are assessed independently of each other and are scaled above and below
their respective targets in the manner set out below.
Percentage of
Criterion Achieved
EBITDA Goal Revenue Goal
Percentage of
Target Incentive
Goal
Percentage of
Total Annual
Incentive
Paid
Percentage of
Target Incentive
Goal
Percentage of
Total Annual
Incentive
Paid
Below 95% ................................ 0% 0% 0% 0%
95% ...................................... 50% 30% 50% 10%
100% ..................................... 100% 60% 100% 20%
105% ..................................... 150% 90% 150% 30%
120% or greater ............................. 200% 120% 200% 40%
As shown in the chart above, if a minimum percentage of the target goal for a criterion is not obtained, no
portion of the executive’s annual incentive for that criterion is paid; if the minimum percentage is reached, 50%
of the target incentive is paid; if the target goal is obtained, 100% of the target incentive is paid; and, if 120% or
more of the target goal is obtained, 200% of the target incentive for that criterion is paid. For example, if 95% of
the EBITDA target was reached, an executive would be paid 50% of the annual incentive target for the EBITDA
goal or 30% (50% x 60%) of the executive’s total annual incentive target. Linear interpolation is used to
determine payouts at achievement levels not set forth in the table.
36