Cincinnati Bell 2010 Annual Report Download - page 136
Download and view the complete annual report
Please find page 136 of the 2010 Cincinnati Bell annual report below. You can navigate through the pages in the report by either clicking on the pages listed below, or by using the keyword search tool below to find specific information within the annual report.-
 1
1 -
2
-
3
-
4
-
5
-
6
-
7
-
8
-
9
-
10
-
11
-
12
-
13
-
14
-
15
-
16
-
17
-
18
-
19
-
20
-
21
-
22
-
23
-
24
-
25
-
26
-
27
-
28
-
29
-
30
-
31
-
32
-
33
-
34
-
35
-
36
-
37
-
38
-
39
-
40
-
41
-
42
-
43
-
44
-
45
-
46
-
47
-
48
-
49
-
50
-
51
-
52
-
53
-
54
-
55
-
56
-
57
-
58
-
59
-
60
-
61
-
62
-
63
-
64
-
65
-
66
-
67
-
68
-
69
-
70
-
71
-
72
-
73
-
74
-
75
-
76
-
77
-
78
-
79
-
80
-
81
-
82
-
83
-
84
-
85
-
86
-
87
-
88
-
89
-
90
-
91
-
92
-
93
-
94
-
95
-
96
-
97
-
98
-
99
-
100
-
101
-
102
-
103
-
104
-
105
-
106
-
107
-
108
-
109
-
110
-
111
-
112
-
113
-
114
-
115
-
116
-
117
-
118
-
119
-
120
-
121
-
122
-
123
-
124
-
125
-
 126
126 -
 127
127 -
 128
128 -
 129
129 -
 130
130 -
 131
131 -
 132
132 -
 133
133 -
 134
134 -
 135
135 -
 136
136 -
 137
137 -
 138
138 -
 139
139 -
 140
140 -
 141
141 -
 142
142 -
 143
143 -
 144
144 -
 145
145 -
 146
146 -
147
-
148
-
149
-
150
-
151
-
152
-
153
-
154
-
155
-
156
-
157
-
158
-
159
-
160
-
161
-
162
-
163
-
164
-
165
-
166
-
167
-
168
-
169
-
170
-
171
-
172
-
173
-
174
-
175
-
176
-
177
-
178
-
179
-
180
-
181
-
182
-
183
-
184
-
185
-
186
-
187
-
188
-
189
-
190
-
191
-
192
-
193
-
194
-
195
-
196
-
197
-
198
-
199
-
200
-
201
-
202
-
203
-
204
-
205
-
206
-
207
-
208
-
209
-
210
-
211
-
212
-
213
-
214
-
215
-
216
 |
 |

be put toward data center opportunities primarily outside of Cincinnati, Ohio and, to a lesser extent, Fioptics
construction, such that growth in 2011 in managed services and professional services will likely be limited.
Business and Consumer Customers
As noted previously in Item 1 under “Customers,” the Company’s revenue from consumer access line
customers has decreased as a percentage of its total revenue, and revenue from other products, such as data center
service for business customers, has increased. The Company expects these trends to continue. Because a large
portion of the costs associated with the Company’s wireline voice service to consumers are fixed network costs,
continued productivity improvements will be necessary and may likely be difficult to continue to achieve in order
for the Company to reduce its costs at the same rate as the revenue losses associated with consumer access line
loss. Conversely, the costs associated with the Company’s business growth products are largely variable in
nature. For example, the construction of new data centers is required to continue business revenue growth for this
service. The Company believes it has largely been successful in the past several years at maintaining revenue and
profitability in the face of high margin consumer access line loss and lower margin business revenue growth, and
it will need to continue to be innovative with new products and services for both consumers and business
customers as well as achieve productivity gains for this success to continue in future years.
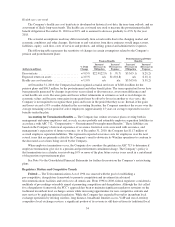
Contractual Obligations
The following table summarizes the Company’s contractual obligations as of December 31, 2010:
(dollars in millions)
Payments Due by Period
Total < 1 Year 1-3 Years 3-5 Years Thereafter
Long-term debt (1) .................................. $2,396.7 $ 0.5 $ 0.9 $247.8 $2,147.5
Capital leases ...................................... 133.4 16.0 18.1 8.4 90.9
Interest payments on long-term debt and capital leases (2) . . . 1,739.1 204.5 406.2 388.9 739.5
Noncancelable operating lease obligations ............... 42.8 11.7 17.7 11.5 1.9
Purchase obligations (3) .............................. 61.8 55.7 5.8 0.3 —
Pension and postretirement benefits obligations (4) ........ 288.3 47.5 96.6 94.0 50.2
Other liabilities (5) .................................. 56.1 14.2 19.2 10.2 12.5
Total ............................................. $4,718.2 $350.1 $564.5 $761.1 $3,042.5
(1) Long-term debt excludes net unamortized discounts and the unamortized call amounts received on terminated
interest rate swaps.
(2) Interest payments on long-term debt and capital leases include interest obligations assuming no early
payment of debt in future periods. All of the Company’s outstanding balances at December 31, 2010 are
fixed rate to maturity.
(3) Purchase obligations primarily consist of amounts under open purchase orders and other purchase
commitments.
(4) Included in pension and postretirement benefit obligations are payments for the Company’s postretirement
benefits, qualified pension plans, non-qualified pension plan and other employee retirement agreements.
Amounts for 2011 include $22.1 million of expected cash contributions for postretirement benefits. Although
the Company currently expects to continue operating the plans past 2011, its contractual obligation related to
postretirement benefits only extends through the end of 2011. Amounts for 2011 through 2017 include
approximately $246 million of estimated cash contributions to its qualified pension plans, with $23.4 million
expected to be contributed in 2011. The Company’s expected qualified pension plan contributions are based
on current plan design, legislation and current actuarial assumptions. Any changes in plan design, the
legislation or actuarial assumptions will also affect the expected contribution amount.
(5) Includes contractual obligation payments primarily related to restructuring reserves, asset removal
obligations, long-term disability obligations, workers compensation liabilities, other financing lease
obligations, and long-term incentive plan obligations.
The contractual obligations table is presented as of December 31, 2010. The amount of these obligations can
be expected to change over time as new contracts are initiated and existing contracts are completed, terminated,
or modified.
46