Cincinnati Bell 2010 Annual Report Download - page 130
Download and view the complete annual report
Please find page 130 of the 2010 Cincinnati Bell annual report below. You can navigate through the pages in the report by either clicking on the pages listed below, or by using the keyword search tool below to find specific information within the annual report.-
 1
1 -
2
-
3
-
4
-
5
-
6
-
7
-
8
-
9
-
10
-
11
-
12
-
13
-
14
-
15
-
16
-
17
-
18
-
19
-
20
-
21
-
22
-
23
-
24
-
25
-
26
-
27
-
28
-
29
-
30
-
31
-
32
-
33
-
34
-
35
-
36
-
37
-
38
-
39
-
40
-
41
-
42
-
43
-
44
-
45
-
46
-
47
-
48
-
49
-
50
-
51
-
52
-
53
-
54
-
55
-
56
-
57
-
58
-
59
-
60
-
61
-
62
-
63
-
64
-
65
-
66
-
67
-
68
-
69
-
70
-
71
-
72
-
73
-
74
-
75
-
76
-
77
-
78
-
79
-
80
-
81
-
82
-
83
-
84
-
85
-
86
-
87
-
88
-
89
-
90
-
91
-
92
-
93
-
94
-
95
-
96
-
97
-
98
-
99
-
100
-
101
-
102
-
103
-
104
-
105
-
106
-
107
-
108
-
109
-
110
-
111
-
112
-
113
-
114
-
115
-
116
-
117
-
118
-
119
-
 120
120 -
 121
121 -
 122
122 -
 123
123 -
 124
124 -
 125
125 -
 126
126 -
 127
127 -
 128
128 -
 129
129 -
 130
130 -
 131
131 -
 132
132 -
 133
133 -
 134
134 -
 135
135 -
 136
136 -
 137
137 -
 138
138 -
 139
139 -
 140
140 -
141
-
142
-
143
-
144
-
145
-
146
-
147
-
148
-
149
-
150
-
151
-
152
-
153
-
154
-
155
-
156
-
157
-
158
-
159
-
160
-
161
-
162
-
163
-
164
-
165
-
166
-
167
-
168
-
169
-
170
-
171
-
172
-
173
-
174
-
175
-
176
-
177
-
178
-
179
-
180
-
181
-
182
-
183
-
184
-
185
-
186
-
187
-
188
-
189
-
190
-
191
-
192
-
193
-
194
-
195
-
196
-
197
-
198
-
199
-
200
-
201
-
202
-
203
-
204
-
205
-
206
-
207
-
208
-
209
-
210
-
211
-
212
-
213
-
214
-
215
-
216
 |
 |

2009 Compared to 2008
Revenue
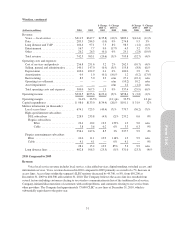
Revenue from telecom and IT equipment distribution decreased by $40.1 million in 2009 versus 2008
primarily as a result of lower capital spending by business customers, particularly in the first half of 2009, due to
the significant decline in the economy.
Professional services revenue for 2009 increased by $4.5 million compared to 2008. The Company
expanded its team of recruiting and hiring personnel in order to focus on selling these outsourcing and consulting
engagements.
Costs and Expenses
Cost of services and products decreased by $37.0 million in 2009 compared to 2008 primarily related to
lower telephony and IT equipment distribution revenue.
Selling, general and administrative expenses increased by $4.1 million in 2009 compared to 2008. The
increase in 2009 was primarily due to an increase in payroll and employee related costs to support the growing
operations and contract services.
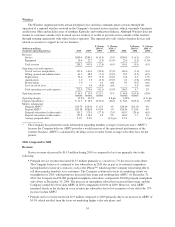
Corporate
Corporate is comprised primarily of general and administrative costs that have not been allocated to the
business segments. Corporate costs totaled $29.0 million in 2010, $20.8 million in 2009, and $21.4 million in 2008.
2010 Compared to 2009
The increase in corporate costs of $8.2 million from 2009 is primarily due to $9.1 million of acquisition
costs on the purchase of CyrusOne and higher payroll and related costs. These cost increases were partially offset
by lower stock-based compensation costs. The mark-to-market impact for the cash-payment compensation plans
that are indexed to the change in the Company’s stock price was $1.0 million of income in 2010.
2009 Compared to 2008
The decrease in corporate costs of $0.6 million from 2008 is due to lower consulting costs of $3.3 million,
lower compensation and other benefits of $3.0 million, a decrease due to a patent lawsuit settlement charge of
$2.0 million in 2008, and lower operating taxes. These cost decreases were offset by a stock-based compensation
increase of $8.5 million, of which $7.7 million is due to the mark-to-market of cash-payment compensation plans
that are indexed to the change in the Company’s stock price, which increased by 79% in 2009.
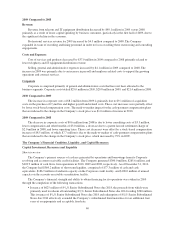
The Company’s Financial Condition, Liquidity, and Capital Resources
Capital Investment, Resources and Liquidity
Short-term view
The Company’s primary sources of cash are generated by operations and borrowings from its Corporate
revolving and accounts receivable credit facilities. The Company generated $300.0 million, $265.6 million, and
$403.9 million of cash flows from operations in 2010, 2009 and 2008, respectively. As of December 31, 2010,
the Company had $364.2 million of short-term liquidity, comprised of $77.3 million of cash and cash
equivalents, $186.9 million of undrawn capacity on the Corporate credit facility, and $100.0 million of unused
capacity on the accounts receivable securitization facility.
The Company’s financial strength and ability to obtain financing for its operations was evident in 2010
through the completion of the following transactions:
•Issuance of $625 million of 83/4% Senior Subordinated Notes due 2018, the proceeds from which were
primarily used to redeem all outstanding 83/8% Senior Subordinated Notes due 2014 totaling $560 million.
This issuance of 83/4% Senior Subordinated Notes due 2018 and redemption of 83/8% Senior Subordinated
Notes due 2014 effectively extended the Company’s subordinated bond maturities for an additional four
years at an appropriate and acceptable fixed rate.
40