Cincinnati Bell 2010 Annual Report Download - page 144
Download and view the complete annual report
Please find page 144 of the 2010 Cincinnati Bell annual report below. You can navigate through the pages in the report by either clicking on the pages listed below, or by using the keyword search tool below to find specific information within the annual report.-
 1
1 -
2
-
3
-
4
-
5
-
6
-
7
-
8
-
9
-
10
-
11
-
12
-
13
-
14
-
15
-
16
-
17
-
18
-
19
-
20
-
21
-
22
-
23
-
24
-
25
-
26
-
27
-
28
-
29
-
30
-
31
-
32
-
33
-
34
-
35
-
36
-
37
-
38
-
39
-
40
-
41
-
42
-
43
-
44
-
45
-
46
-
47
-
48
-
49
-
50
-
51
-
52
-
53
-
54
-
55
-
56
-
57
-
58
-
59
-
60
-
61
-
62
-
63
-
64
-
65
-
66
-
67
-
68
-
69
-
70
-
71
-
72
-
73
-
74
-
75
-
76
-
77
-
78
-
79
-
80
-
81
-
82
-
83
-
84
-
85
-
86
-
87
-
88
-
89
-
90
-
91
-
92
-
93
-
94
-
95
-
96
-
97
-
98
-
99
-
100
-
101
-
102
-
103
-
104
-
105
-
106
-
107
-
108
-
109
-
110
-
111
-
112
-
113
-
114
-
115
-
116
-
117
-
118
-
119
-
120
-
121
-
122
-
123
-
124
-
125
-
126
-
127
-
128
-
129
-
130
-
131
-
132
-
133
-
 134
134 -
 135
135 -
 136
136 -
 137
137 -
 138
138 -
 139
139 -
 140
140 -
 141
141 -
 142
142 -
 143
143 -
 144
144 -
 145
145 -
 146
146 -
 147
147 -
 148
148 -
 149
149 -
 150
150 -
 151
151 -
 152
152 -
 153
153 -
 154
154 -
155
-
156
-
157
-
158
-
159
-
160
-
161
-
162
-
163
-
164
-
165
-
166
-
167
-
168
-
169
-
170
-
171
-
172
-
173
-
174
-
175
-
176
-
177
-
178
-
179
-
180
-
181
-
182
-
183
-
184
-
185
-
186
-
187
-
188
-
189
-
190
-
191
-
192
-
193
-
194
-
195
-
196
-
197
-
198
-
199
-
200
-
201
-
202
-
203
-
204
-
205
-
206
-
207
-
208
-
209
-
210
-
211
-
212
-
213
-
214
-
215
-
216
 |
 |

Health care cost trend
The Company’s health care cost trend rate is developed on historical cost data, the near-term outlook, and an
assessment of likely long-term trends. The health care cost trend rate used to measure the postretirement health
benefit obligation at December 31, 2010 was 8.0% and is assumed to decrease gradually to 4.5% by the year
2018.
The actuarial assumptions used may differ materially from actual results due to the changing market and
economic conditions and other changes. Revisions to and variations from these estimates would impact assets,
liabilities, equity, cash flow, costs of services and products, and selling, general and administrative expenses.
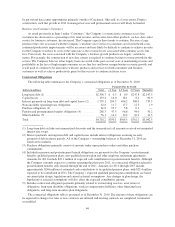
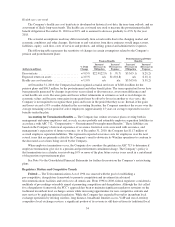
The following table represents the sensitivity of changes in certain assumptions related to the Company’s
pension and postretirement plans:
% Point
Change
Pension Benefits
Postretirement and Other
Benefits
(dollars in millions)
Increase/
(Decrease) in
Obligation
Increase/
(Decrease) in
Expense
Increase/
(Decrease) in
Obligation
Increase/
(Decrease) in
Expense
Discount rate ........................... +/-0.5% $22.9/(22.9) $ .7/(.7) $5.5/(5.1) $.2/(.2)
Expected return on assets .................. +/-0.5% n/a $1.8/(1.8) n/a $.1/(.1)
Health care cost trend rate ................. +/-1.0% n/a n/a $5.5/(5.0) $.3/(.2)
At December 31, 2010, the Company had unrecognized actuarial net losses of $248.4 million for the
pension plans and $96.3 million for the postretirement and other benefit plans. The unrecognized net losses have
been primarily generated by changes in previous years related to discount rates, asset return differences and
actual health care costs. Because gains and losses reflect refinements in estimates as well as real changes in
economic values and because some gains in one period may be offset by losses in another or vice versa, the
Company is not required to recognize these gains and losses in the period that they occur. Instead, if the gains
and losses exceed a 10% corridor defined in the accounting literature, the Company amortizes the excess over the
average remaining service period of active employees (approximately 15 years on average) expected to receive
benefits under the plan.
Accounting for Termination Benefits — The Company has written severance plans covering both its
management and union employees and, as such, accrues probable and estimable employee separation liabilities in
accordance with ASC 712, “Compensation — Nonretirement Postemployment Benefits.” These liabilities are
based on the Company’s historical experience of severance, historical costs associated with severance, and
management’s expectation of future severance. As of December 31, 2010, the Company has $11.7 million of
accrued employee separation liabilities. This represents expected severance costs for employees over the next
several years that are primarily related to the Company’s need to downsize its Wireline operations to conform to
the decreased access lines being served by the Company.
When employee terminations occur, the Company also considers the guidance in ASC 715 to determine if
employee terminations give rise to a pension and postretirement curtailment charge. The Company’s policy is
that terminations in a calendar year involving 10% or more of the plan future service years result in a curtailment
of the pension or postretirement plan.
See Note 9 to the Consolidated Financial Statements for further discussion on the Company’s restructuring
plans.
Regulatory Matters and Competitive Trends
Federal — The Telecommunications Act of 1996 was enacted with the goal of establishing a
pro-competitive, deregulatory framework to promote competition and investment in advanced
telecommunications facilities and services to all Americans. From 1996 to 2008, federal regulators considered a
multitude of proceedings ostensibly aimed at promoting competition and deregulation. Although the Act called
for a deregulatory framework, the FCC’s approach has been to maintain significant regulatory restraints on the
traditional incumbent local exchange carriers while increasing opportunities for new competitive entrants and
new services by applying minimal regulation. While the Company has expanded beyond its incumbent local
exchange operations by offering wireless, long distance, broadband, Internet access, VoIP and out-of-territory
competitive local exchange services, a significant portion of its revenue is still derived from its traditional local
54