Cincinnati Bell 2010 Annual Report Download - page 129
Download and view the complete annual report
Please find page 129 of the 2010 Cincinnati Bell annual report below. You can navigate through the pages in the report by either clicking on the pages listed below, or by using the keyword search tool below to find specific information within the annual report.-
 1
1 -
2
-
3
-
4
-
5
-
6
-
7
-
8
-
9
-
10
-
11
-
12
-
13
-
14
-
15
-
16
-
17
-
18
-
19
-
20
-
21
-
22
-
23
-
24
-
25
-
26
-
27
-
28
-
29
-
30
-
31
-
32
-
33
-
34
-
35
-
36
-
37
-
38
-
39
-
40
-
41
-
42
-
43
-
44
-
45
-
46
-
47
-
48
-
49
-
50
-
51
-
52
-
53
-
54
-
55
-
56
-
57
-
58
-
59
-
60
-
61
-
62
-
63
-
64
-
65
-
66
-
67
-
68
-
69
-
70
-
71
-
72
-
73
-
74
-
75
-
76
-
77
-
78
-
79
-
80
-
81
-
82
-
83
-
84
-
85
-
86
-
87
-
88
-
89
-
90
-
91
-
92
-
93
-
94
-
95
-
96
-
97
-
98
-
99
-
100
-
101
-
102
-
103
-
104
-
105
-
106
-
107
-
108
-
109
-
110
-
111
-
112
-
113
-
114
-
115
-
116
-
117
-
118
-
 119
119 -
 120
120 -
 121
121 -
 122
122 -
 123
123 -
 124
124 -
 125
125 -
 126
126 -
 127
127 -
 128
128 -
 129
129 -
 130
130 -
 131
131 -
 132
132 -
 133
133 -
 134
134 -
 135
135 -
 136
136 -
 137
137 -
 138
138 -
 139
139 -
140
-
141
-
142
-
143
-
144
-
145
-
146
-
147
-
148
-
149
-
150
-
151
-
152
-
153
-
154
-
155
-
156
-
157
-
158
-
159
-
160
-
161
-
162
-
163
-
164
-
165
-
166
-
167
-
168
-
169
-
170
-
171
-
172
-
173
-
174
-
175
-
176
-
177
-
178
-
179
-
180
-
181
-
182
-
183
-
184
-
185
-
186
-
187
-
188
-
189
-
190
-
191
-
192
-
193
-
194
-
195
-
196
-
197
-
198
-
199
-
200
-
201
-
202
-
203
-
204
-
205
-
206
-
207
-
208
-
209
-
210
-
211
-
212
-
213
-
214
-
215
-
216
 |
 |

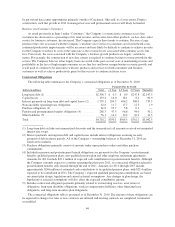
IT Services and Hardware
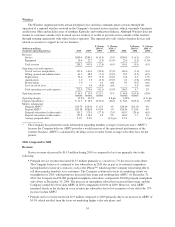
The IT Services and Hardware segment provides a full range of managed IT solutions, including managed
infrastructure services, IT and telephony equipment sales, and professional IT staffing services. These services
and products are provided in multiple states through the Company’s subsidiaries, Cincinnati Bell Technology
Solutions Inc. (“CBTS”), CBTS Canada Inc., and CBTS Software LLC. By offering a full range of equipment
and outsourced services in conjunction with the Company’s wireline network services, the IT Services and
Hardware segment provides end-to-end IT and telecommunications infrastructure management designed to
reduce cost and mitigate risk while optimizing performance for its customers.
(dollars in millions) 2010 2009
$ Change
2010 vs.
2009
% Change
2010 vs.
2009 2008
$ Change
2009 vs.
2008
% Change
2009 vs.
2008
Revenue:
Telecom and IT equipment distribution ..... $174.9 $161.1 $13.8 9% $201.2 $(40.1) (20)%
Managed services ...................... 55.1 49.4 5.7 12% 49.7 (0.3) (1)%
Professional services .................... 24.7 20.8 3.9 19% 16.3 4.5 28%
Total revenue ......................... 254.7 231.3 23.4 10% 267.2 (35.9) (13)%
Operating costs and expenses:
Cost of services and products ............. 202.6 182.1 20.5 11% 219.1 (37.0) (17)%
Selling, general and administrative ........ 37.7 32.3 5.4 17% 28.2 4.1 15%
Depreciation .......................... 6.9 5.8 1.1 19% 5.3 0.5 9%
Amortization .......................... 0.4 0.4 — 0% 0.5 (0.1) (20)%
Restructuring ......................... 2.8 — 2.8 n/m 0.7 (0.7) n/m
Total operating costs and expenses ........ 250.4 220.6 29.8 14% 253.8 (33.2) (13)%
Operating income ........................ $ 4.3 $ 10.7 $ (6.4) (60)% $ 13.4 $ (2.7) (20)%
Operating margin ........................ 1.7% 4.6% (2.9) pts 5.0% (0.4) pts
Capital expenditures ...................... $ 8.3 $ 3.8 $ 4.5 118% $ 4.3 $ (0.5) (12)%
2010 Compared to 2009
Revenue
Revenue from telecom and IT equipment distribution represents the sale, installation, and maintenance of
major, branded IT and telephony equipment. Revenue from telecom and IT equipment distribution increased by
$13.8 million in 2010 versus 2009 primarily due to higher hardware sales and increased capital spending by
business customers from the prior year as a result of the improving economy in 2010.
Managed services revenue consists of revenue for managed VoIP solutions and IT services that include
network management, electronic data storage, disaster recovery and data security management. Managed
services revenue increased by $5.7 million in 2010 versus 2009, due primarily to an increase in services provided
to one of the Company’s largest customers of $5.2 million.
Professional services revenue consists of long-term and short-term IT outsourcing and consulting
engagements. Revenue for 2010 increased by $3.9 million compared to 2009, as the Company continued to
expand its portfolio of IT professionals to grow these outsourcing and consulting engagements.
Costs and Expenses
Cost of services and products increased by $20.5 million in 2010 compared to 2009 primarily due to an
$11.5 million increase related to higher telecom and equipment distribution revenue and higher payroll related
costs to support the growth in managed services and professional services revenues.
Selling, general and administrative expenses increased by $5.4 million in 2010 compared to 2009. The
increase in 2010 was due to an increase of $6.1 million in payroll and employee related costs to support the
growing operations.
The increase in depreciation expense for 2010 compared to 2009 was primarily due to the increased capital
expenditures to support the expansion of managed services and professional services projects.
During 2010, the IT Services and Hardware segment incurred employee separation charges of $2.8 million
associated with the integration of certain functions with the Wireline segment.
39
Form 10-K