Cincinnati Bell 2010 Annual Report Download - page 117
Download and view the complete annual report
Please find page 117 of the 2010 Cincinnati Bell annual report below. You can navigate through the pages in the report by either clicking on the pages listed below, or by using the keyword search tool below to find specific information within the annual report.-
 1
1 -
2
-
3
-
4
-
5
-
6
-
7
-
8
-
9
-
10
-
11
-
12
-
13
-
14
-
15
-
16
-
17
-
18
-
19
-
20
-
21
-
22
-
23
-
24
-
25
-
26
-
27
-
28
-
29
-
30
-
31
-
32
-
33
-
34
-
35
-
36
-
37
-
38
-
39
-
40
-
41
-
42
-
43
-
44
-
45
-
46
-
47
-
48
-
49
-
50
-
51
-
52
-
53
-
54
-
55
-
56
-
57
-
58
-
59
-
60
-
61
-
62
-
63
-
64
-
65
-
66
-
67
-
68
-
69
-
70
-
71
-
72
-
73
-
74
-
75
-
76
-
77
-
78
-
79
-
80
-
81
-
82
-
83
-
84
-
85
-
86
-
87
-
88
-
89
-
90
-
91
-
92
-
93
-
94
-
95
-
96
-
97
-
98
-
99
-
100
-
101
-
102
-
103
-
104
-
105
-
106
-
 107
107 -
 108
108 -
 109
109 -
 110
110 -
 111
111 -
 112
112 -
 113
113 -
 114
114 -
 115
115 -
 116
116 -
 117
117 -
 118
118 -
 119
119 -
 120
120 -
 121
121 -
 122
122 -
 123
123 -
 124
124 -
 125
125 -
 126
126 -
 127
127 -
128
-
129
-
130
-
131
-
132
-
133
-
134
-
135
-
136
-
137
-
138
-
139
-
140
-
141
-
142
-
143
-
144
-
145
-
146
-
147
-
148
-
149
-
150
-
151
-
152
-
153
-
154
-
155
-
156
-
157
-
158
-
159
-
160
-
161
-
162
-
163
-
164
-
165
-
166
-
167
-
168
-
169
-
170
-
171
-
172
-
173
-
174
-
175
-
176
-
177
-
178
-
179
-
180
-
181
-
182
-
183
-
184
-
185
-
186
-
187
-
188
-
189
-
190
-
191
-
192
-
193
-
194
-
195
-
196
-
197
-
198
-
199
-
200
-
201
-
202
-
203
-
204
-
205
-
206
-
207
-
208
-
209
-
210
-
211
-
212
-
213
-
214
-
215
-
216
 |
 |

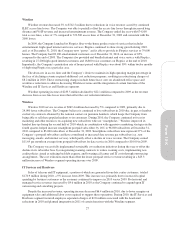
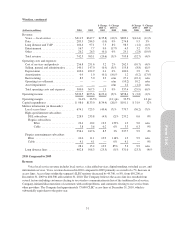
Wireline
Wireline revenue decreased 3% to $742.5 million due to reductions in voice revenue caused by continued
ILEC access line losses. The Company was able to partially offset the access line losses through increased long
distance and VoIP revenue and increased entertainment revenue. The Company ended the year with 674,100
total access lines, a loss of 7% compared to 723,500 access lines at December 31, 2009 and consistent with the
2009 losses.
In 2009, the Company launched its Fioptics fiber-to-the-home product suite of services that includes
entertainment, high-speed internet and voice services. Fioptics continued to show strong growth during 2010,
and, as of December 31, 2010, the Company now “passes” and is able to provide its Fioptics services to 79,000
homes. The Company had 28,100 entertainment customers as of December 31, 2010, an increase of 85%
compared to the end of 2009. The Company also provided and bundled internet and voice service with Fioptics,
resulting in 27,200 high-speed internet customers and 16,800 voice customers on Fioptics at the end of 2010.
Importantly, the Company’s penetration rate of homes passed with Fioptics was about 30% within twelve months
of deploying Fioptics in a particular area.
The decreases in access lines and the Company’s desire to maintain its high operating margin percentage in
the face of declining revenue required additional cost reduction programs, resulting in restructuring charges of
$8.2 million in 2010. These restructuring charges include future lease costs on abandoned office space and
workforce reductions to address decreasing Wireline revenue and the integration of certain functions of the
Wireline and IT Services and Hardware segments.
Wireline operating income of $233.5 million declined by $22.1 million compared to 2009 as the revenue
decrease from access line losses more than offset the cost reduction initiatives.
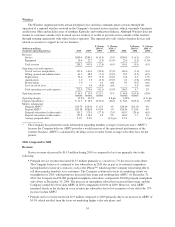
Wireless
Wireless 2010 service revenue of $269.4 million decreased by 5% compared to 2009, primarily due to
24,000 fewer subscribers. The Company believes it continued to lose subscribers in 2010 due, in part, to handset
exclusivity contracts obtained by the national carriers on premium handsets, which keeps the Company from
being able to sell these popular handsets to its customers. During 2010, the Company continued to focus its
marketing and other resources on acquiring new subscribers who use “smartphones.” Wireless improved its
handset line-up during the second half of 2010 which, in combination with aggressive marketing strategies in the
fourth quarter, helped increase smartphone postpaid subscribers by 16% to 96,000 subscribers at December 31,
2010 compared to 83,000 subscribers at December 31, 2009. Smartphone subscribers now represent 27% of the
Company’s postpaid subscribers and have contributed to increased data revenue per subscriber (e.g., text
messaging, emails, and internet service), which partly offset a decline in voice revenue. The Company earned
$11.69 per month on average from postpaid subscribers for data service in 2010 compared to $10.00 in 2009.
The Company successfully implemented sustainable cost reduction initiatives during the year to offset the
decline in its subscriber base by renegotiating roaming contracts to reduce roaming costs, implementing new
credit policies aimed at reducing bad debt expense, and lowering call center and IT costs through outsourcing
arrangements. The cost reductions more than offset the lower postpaid service revenue resulting in a $23.3
million increase of Wireless segment operating income over 2009.
IT Services and Hardware
Sales of telecom and IT equipment, a portion of which are generated from data center customers, totaled
$174.9 million during 2010, a 9% increase from 2009. This increase was primarily due to increased capital
spending by business customers as the economy continued to improve in 2010 versus 2009. Professional and
managed service revenues increased by $9.6 million in 2010 as the Company continued to expand upon IT
outsourcing and consulting projects.
Despite the increased revenue, operating income decreased $6.4 million in 2010, due to lower margins on
equipment sales and additional labor costs required to support these operations. During 2010, the IT Services and
Hardware segment incurred employee separation charges of $2.8 million associated with the headcount
reductions in 2010 and planned integration in 2011 of certain functions with the Wireline segment.
27
Form 10-K