Cincinnati Bell 2010 Annual Report Download - page 180
Download and view the complete annual report
Please find page 180 of the 2010 Cincinnati Bell annual report below. You can navigate through the pages in the report by either clicking on the pages listed below, or by using the keyword search tool below to find specific information within the annual report.-
 1
1 -
2
-
3
-
4
-
5
-
6
-
7
-
8
-
9
-
10
-
11
-
12
-
13
-
14
-
15
-
16
-
17
-
18
-
19
-
20
-
21
-
22
-
23
-
24
-
25
-
26
-
27
-
28
-
29
-
30
-
31
-
32
-
33
-
34
-
35
-
36
-
37
-
38
-
39
-
40
-
41
-
42
-
43
-
44
-
45
-
46
-
47
-
48
-
49
-
50
-
51
-
52
-
53
-
54
-
55
-
56
-
57
-
58
-
59
-
60
-
61
-
62
-
63
-
64
-
65
-
66
-
67
-
68
-
69
-
70
-
71
-
72
-
73
-
74
-
75
-
76
-
77
-
78
-
79
-
80
-
81
-
82
-
83
-
84
-
85
-
86
-
87
-
88
-
89
-
90
-
91
-
92
-
93
-
94
-
95
-
96
-
97
-
98
-
99
-
100
-
101
-
102
-
103
-
104
-
105
-
106
-
107
-
108
-
109
-
110
-
111
-
112
-
113
-
114
-
115
-
116
-
117
-
118
-
119
-
120
-
121
-
122
-
123
-
124
-
125
-
126
-
127
-
128
-
129
-
130
-
131
-
132
-
133
-
134
-
135
-
136
-
137
-
138
-
139
-
140
-
141
-
142
-
143
-
144
-
145
-
146
-
147
-
148
-
149
-
150
-
151
-
152
-
153
-
154
-
155
-
156
-
157
-
158
-
159
-
160
-
161
-
162
-
163
-
164
-
165
-
166
-
167
-
168
-
169
-
 170
170 -
 171
171 -
 172
172 -
 173
173 -
 174
174 -
 175
175 -
 176
176 -
 177
177 -
 178
178 -
 179
179 -
 180
180 -
 181
181 -
 182
182 -
 183
183 -
 184
184 -
 185
185 -
 186
186 -
 187
187 -
 188
188 -
 189
189 -
 190
190 -
191
-
192
-
193
-
194
-
195
-
196
-
197
-
198
-
199
-
200
-
201
-
202
-
203
-
204
-
205
-
206
-
207
-
208
-
209
-
210
-
211
-
212
-
213
-
214
-
215
-
216
 |
 |

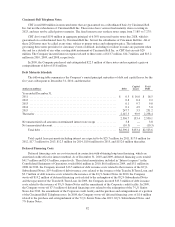
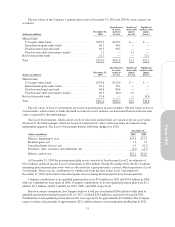
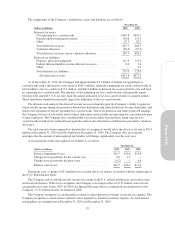
The amounts recognized in the Consolidated Balance Sheets consist of:
Pension Benefits
Postretirement and
Other Benefits
December 31, December 31,
(dollars in millions) 2010 2009 2010 2009
Accrued payroll and benefits (current liability) ..................... $ (1.9) $ (1.9) $ (22.1) $ (13.0)
Pension and postretirement benefit obligations (noncurrent liability) . . . (200.2) (179.0) (129.1) (132.2)
As of December 31, 2010 and 2009, the Company’s accumulated benefit obligation related to its pension
plans was $526.1 million and $506.3 million, respectively.
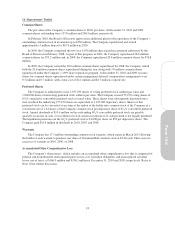
Amounts recognized in “Accumulated other comprehensive loss” in the Consolidated Balance Sheets
consisted of the following:
Pension Benefits
Postretirement and
Other Benefits
December 31, December 31,
(dollars in millions) 2010 2009 2010 2009
Prior service benefit (cost) .......................... $ (5.2) $ (5.7) $ 98.2 $111.3
Actuarial loss ..................................... (248.4) (230.6) (96.3) (89.6)
(253.6) (236.3) 1.9 21.7
Income tax effect .................................. 92.4 86.4 (0.7) (7.9)
$(161.2) $(149.9) $ 1.2 $ 13.8
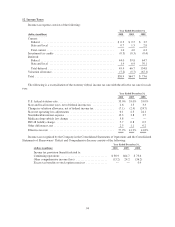
Amounts recognized in “Accumulated other comprehensive loss” on the Consolidated Statements of
Shareowners’ Deficit and Comprehensive Income for the year ended December 31, 2010, are shown below:
(dollars in millions)
Pension
Benefits
Postretirement
and Other
Benefits
Prior service cost recognized:
Reclassification adjustments ...................................... $ 0.5 $(13.1)
Actuarial loss recognized:
Reclassification adjustments ...................................... 9.3 5.2
Actuarial loss arising during the period .............................. (27.1) (11.9)
The following amounts currently included in “Accumulated other comprehensive loss” are expected to be
recognized in 2011 as a component of net periodic pension and postretirement cost:
(dollars in millions)
Pension
Benefits
Postretirement
and Other
Benefits
Prior service cost (benefit) ........................................ $ 0.5 $(13.1)
Actuarial loss .................................................. 13.3 5.9
Plan Assets, Investment Policies and Strategies
The primary investment objective for the trusts holding the assets of the pension and postretirement plans is
preservation of capital with a reasonable amount of long-term growth and income without undue exposure to
risk. This is provided by a balanced strategy using fixed income and equity securities. The target allocations for
the pension plan assets are 61% equity securities, 31% investment grade fixed income securities and 8% in
pooled real estate funds. Equity securities are primarily held in the form of passively managed funds that seek to
track the performance of a benchmark index. Equity securities include investments in growth and value common
stocks of companies located in the United States, which represents approximately 80% of the equity securities
held by the pension plans at December 31, 2010, as well as stock of international companies located in both
developed and emerging markets around the world. Fixed income securities primarily include holdings of funds
which generally invest in a variety of intermediate and long-term investment grade corporate bonds from
diversified industries. The postretirement plan assets are currently invested in various short-term liquid funds.
90