Cincinnati Bell 2010 Annual Report Download - page 48
Download and view the complete annual report
Please find page 48 of the 2010 Cincinnati Bell annual report below. You can navigate through the pages in the report by either clicking on the pages listed below, or by using the keyword search tool below to find specific information within the annual report.-
 1
1 -
2
-
3
-
4
-
5
-
6
-
7
-
8
-
9
-
10
-
11
-
12
-
13
-
14
-
15
-
16
-
17
-
18
-
19
-
20
-
21
-
22
-
23
-
24
-
25
-
26
-
27
-
28
-
29
-
30
-
31
-
32
-
33
-
34
-
35
-
36
-
37
-
 38
38 -
 39
39 -
 40
40 -
 41
41 -
 42
42 -
 43
43 -
 44
44 -
 45
45 -
 46
46 -
 47
47 -
 48
48 -
 49
49 -
 50
50 -
 51
51 -
 52
52 -
 53
53 -
 54
54 -
 55
55 -
 56
56 -
 57
57 -
 58
58 -
59
-
60
-
61
-
62
-
63
-
64
-
65
-
66
-
67
-
68
-
69
-
70
-
71
-
72
-
73
-
74
-
75
-
76
-
77
-
78
-
79
-
80
-
81
-
82
-
83
-
84
-
85
-
86
-
87
-
88
-
89
-
90
-
91
-
92
-
93
-
94
-
95
-
96
-
97
-
98
-
99
-
100
-
101
-
102
-
103
-
104
-
105
-
106
-
107
-
108
-
109
-
110
-
111
-
112
-
113
-
114
-
115
-
116
-
117
-
118
-
119
-
120
-
121
-
122
-
123
-
124
-
125
-
126
-
127
-
128
-
129
-
130
-
131
-
132
-
133
-
134
-
135
-
136
-
137
-
138
-
139
-
140
-
141
-
142
-
143
-
144
-
145
-
146
-
147
-
148
-
149
-
150
-
151
-
152
-
153
-
154
-
155
-
156
-
157
-
158
-
159
-
160
-
161
-
162
-
163
-
164
-
165
-
166
-
167
-
168
-
169
-
170
-
171
-
172
-
173
-
174
-
175
-
176
-
177
-
178
-
179
-
180
-
181
-
182
-
183
-
184
-
185
-
186
-
187
-
188
-
189
-
190
-
191
-
192
-
193
-
194
-
195
-
196
-
197
-
198
-
199
-
200
-
201
-
202
-
203
-
204
-
205
-
206
-
207
-
208
-
209
-
210
-
211
-
212
-
213
-
214
-
215
-
216
 |
 |
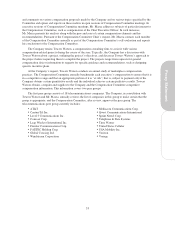
The second peer group is comprised of 120 companies, in various industries, with annual revenues between
$1 billion and $3 billion. These companies are chosen because they have annual revenues that are closely aligned
with the Company’s revenues, and they provide the Company and the Compensation Committee with insight
with respect to executive compensation practices across a wide cross-section of industries. These companies
include:
•Advanced Medical Optics •Day & Zimmermann •International Game
Technology
•Ralcorp Holdings
•Alexander & Baldwin •Deluxe •Iron Mountain •Rayonier
•American Crystal Sugar •Dentsply •Irvine Company •Revlon
•AMETEK •Discovery
Communications
•J.M. Smucker •RF Micro Devices
•Ann Taylor Stores •Donaldson •Jack in the Box •Rich Products
•Applera •E.W. Scripps •Jostens •Safety-Kleen Systems
•Appleton Papers •Endo Pharmaceuticals •Kaman Industrial
Technologies
•SAS Institute
•Arby’s Restaurant Group •Equifax •Kennametal •Schreiber Foods
•Arysta LifeScience North
America
•Exterran •Kerzner International •Scotts Miracle Gro
•Barr Pharmaceuticals •Fleetwood Enterprises •KLA-Tencor •Sensata Technologies
•Beckman Coulter •Flint Group USA •Magellan Midstream
Partners
•Shire Pharmaceuticals
•BIC •G&K Services •Makino •Sigma-Aldrich
•Biogen Idec •GATX •Martin Marietta Materials •Sirius Satellite Radio
•Bio-Rad Laboratories •General Atomics •Mary Kay •Smith & Nephew
•Blyth •GEO Group •McClatchy •Springs Global US
•Bob Evans Farms •Getty Images •MDS Pharma Services •Stantec
•Bracco Diagnostics •Greif •Media General •Steelcase
•Brady •GTECH •Metavante Technologies •Stewart & Stevenson
•Burger King •H.B. Fuller •MetroPCS
Communications
•TeleTech Holdings
•Carpenter Technology •Harland Clarke •Millipore •Teradata
•CashNetUSA •Hayes-Lemmerz •Monaco Coach •Terra Industries
•Catalent Pharma
Solutions
•Hercules •Mueller Water Products •Thomas & Betts
•Celgene •Herman Miller •National Semiconductor •Toro
•Cephalon •HNI •New York Times
•
Tupperware
•Ceridian •Hospira •Noranda Aluminum •Underwriters
Laboratories
•Chesapeake •Houghton Mifflin •Nypro •Uni-Select USA
•COACH •Hunt Consolidated •PerkinElmer •Virgin Mobile USA
•Convergys •IDEX •PolyOne •Vistar
•Crown Castle •IMS Health •Purdue Pharma •Vulcan Materials
•Cubic •International Flavors &
Fragrances
•Quintiles •Wendy’s International
In establishing its compensation programs, the Company evaluates the following from both peer groups’
data:
•Base pay.
•Total target cash compensation — the sum of base pay plus target annual bonus opportunity.
•Total target direct compensation — the sum of base pay plus target annual bonus opportunity plus target
long-term incentive opportunity.
34