Cincinnati Bell 2007 Annual Report Download - page 56
Download and view the complete annual report
Please find page 56 of the 2007 Cincinnati Bell annual report below. You can navigate through the pages in the report by either clicking on the pages listed below, or by using the keyword search tool below to find specific information within the annual report.-
 1
1 -
2
-
3
-
4
-
5
-
6
-
7
-
8
-
9
-
10
-
11
-
12
-
13
-
14
-
15
-
16
-
17
-
18
-
19
-
20
-
21
-
22
-
23
-
24
-
25
-
26
-
27
-
28
-
29
-
30
-
31
-
32
-
33
-
34
-
35
-
36
-
37
-
38
-
39
-
40
-
41
-
42
-
43
-
44
-
45
-
 46
46 -
 47
47 -
 48
48 -
 49
49 -
 50
50 -
 51
51 -
 52
52 -
 53
53 -
 54
54 -
 55
55 -
 56
56 -
 57
57 -
 58
58 -
 59
59 -
 60
60 -
 61
61 -
 62
62 -
 63
63 -
 64
64 -
 65
65 -
 66
66 -
67
-
68
-
69
-
70
-
71
-
72
-
73
-
74
-
75
-
76
-
77
-
78
-
79
-
80
-
81
-
82
-
83
-
84
-
85
-
86
-
87
-
88
-
89
-
90
-
91
-
92
-
93
-
94
-
95
-
96
-
97
-
98
-
99
-
100
-
101
-
102
-
103
-
104
-
105
-
106
-
107
-
108
-
109
-
110
-
111
-
112
-
113
-
114
-
115
-
116
-
117
-
118
-
119
-
120
-
121
-
122
-
123
-
124
-
125
-
126
-
127
-
128
-
129
-
130
-
131
-
132
-
133
-
134
-
135
-
136
-
137
-
138
-
139
-
140
-
141
-
142
-
143
-
144
-
145
-
146
-
147
-
148
-
149
-
150
-
151
-
152
-
153
-
154
-
155
-
156
-
157
-
158
-
159
-
160
-
161
-
162
-
163
-
164
-
165
-
166
-
167
-
168
-
169
-
170
-
171
-
172
-
173
-
174
-
175
-
176
-
177
-
178
-
179
-
180
-
181
-
182
-
183
-
184
-
185
-
186
-
187
-
188
-
189
-
190
-
191
-
192
 |
 |
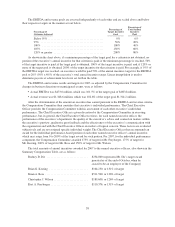
Mr. Cassidy reviewed each element of each executive’s total compensation opportunity — base salary,
annual bonus and long-term incentive compensation — with the Compensation Committee. In addition, the
Compensation Committee reviewed a tally sheet showing the value or cost of participation in the Company’s
various benefit, retirement and perquisite plans for each named executive officer.
Based on the principles previously discussed, Mr. Cassidy recommended, and the Compensation Committee
approved, the following changes in compensation for 2008:
Base Salary:
•Mr. Ross’s salary remained unchanged at $375,000, which is 94% of the peer group benchmark.
•Mr. Freyberger’s salary was increased from $210,000 to $225,000, which is 102% of the peer group
benchmark.
•Mr. Keating’s salary was increased from $250,000 to $257,500, which is 95% of the peer group
benchmark.
•Mr. Wilson’s salary was increased from $300,000 to $309,000, which is 95% of the peer group
benchmark.
Annual Bonus Target:
•Mr. Ross’s target bonus remained unchanged at 100% of base salary, which is 133% of the peer group
benchmark.
•Mr. Freyberger’s target bonus remained unchanged at 40% of base salary, which is 106% of the peer
group benchmark.
•Mr. Keating’s target bonus remained unchanged at 50% of base salary, which is 99% of the peer group
benchmark.
•Mr. Wilson’s target bonus remained unchanged at 50% of base salary, which is 76% of the peer group
benchmark.
Long-Term Incentives:
•For the 2007 fiscal year, Mr. Freyberger was granted 10,000 performance units (at target) with respect to
the 2007-2009 performance period and a nonqualified stock option for 25,000 common shares. For the
2008 fiscal year, Mr. Freyberger was granted 19,100 performance units (at target) with respect to the
2008-2010 performance period and a nonqualified stock option for 25,000 common shares.
Mr. Freyberger’s total 2007 opportunity was equal to 84% of the benchmark and his total 2008
opportunity was equal to 107% of the benchmark.
•For the 2007 fiscal year, Mr. Keating was granted 30,000 performance units (at target) with respect to the
2007-2009 performance period and a nonqualified stock option for 50,000 common shares. For the 2008
fiscal year, Mr. Keating was granted 38,201 performance units (at target) with respect to the 2008-2010
performance period and a nonqualified stock option for 50,000 common shares. Mr. Keating’s total 2007
opportunity was equal to 121% of the benchmark and his total 2008 opportunity was equal to 122% of the
benchmark.
•For the 2007 fiscal year, Mr. Ross was granted 75,000 performance units (at target) with respect to the
2007-2009 performance period and a nonqualified stock option for 200,000 common shares. For the 2008
fiscal year, Mr. Ross was granted 191,007 performance units (at target) with respect to the 2008-2010
performance period and a nonqualified stock option for 250,000 common shares. Mr. Ross’s total 2007
opportunity was equal to 111% of the benchmark and his total 2008 opportunity was equal to 184% of the
benchmark.
42