Cincinnati Bell 2007 Annual Report Download - page 143
Download and view the complete annual report
Please find page 143 of the 2007 Cincinnati Bell annual report below. You can navigate through the pages in the report by either clicking on the pages listed below, or by using the keyword search tool below to find specific information within the annual report.-
 1
1 -
2
-
3
-
4
-
5
-
6
-
7
-
8
-
9
-
10
-
11
-
12
-
13
-
14
-
15
-
16
-
17
-
18
-
19
-
20
-
21
-
22
-
23
-
24
-
25
-
26
-
27
-
28
-
29
-
30
-
31
-
32
-
33
-
34
-
35
-
36
-
37
-
38
-
39
-
40
-
41
-
42
-
43
-
44
-
45
-
46
-
47
-
48
-
49
-
50
-
51
-
52
-
53
-
54
-
55
-
56
-
57
-
58
-
59
-
60
-
61
-
62
-
63
-
64
-
65
-
66
-
67
-
68
-
69
-
70
-
71
-
72
-
73
-
74
-
75
-
76
-
77
-
78
-
79
-
80
-
81
-
82
-
83
-
84
-
85
-
86
-
87
-
88
-
89
-
90
-
91
-
92
-
93
-
94
-
95
-
96
-
97
-
98
-
99
-
100
-
101
-
102
-
103
-
104
-
105
-
106
-
107
-
108
-
109
-
110
-
111
-
112
-
113
-
114
-
115
-
116
-
117
-
118
-
119
-
120
-
121
-
122
-
123
-
124
-
125
-
126
-
127
-
128
-
129
-
130
-
131
-
132
-
 133
133 -
 134
134 -
 135
135 -
 136
136 -
 137
137 -
 138
138 -
 139
139 -
 140
140 -
 141
141 -
 142
142 -
 143
143 -
 144
144 -
 145
145 -
 146
146 -
 147
147 -
 148
148 -
 149
149 -
 150
150 -
 151
151 -
 152
152 -
 153
153 -
154
-
155
-
156
-
157
-
158
-
159
-
160
-
161
-
162
-
163
-
164
-
165
-
166
-
167
-
168
-
169
-
170
-
171
-
172
-
173
-
174
-
175
-
176
-
177
-
178
-
179
-
180
-
181
-
182
-
183
-
184
-
185
-
186
-
187
-
188
-
189
-
190
-
191
-
192
 |
 |

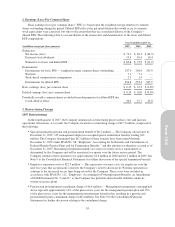
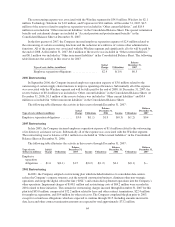
2. Earnings (Loss) Per Common Share
Basic earnings (loss) per common share (“EPS”) is based upon the weighted average number of common
shares outstanding during the period. Diluted EPS reflects the potential dilution that would occur if common
stock equivalents were exercised, but only to the extent that they are considered dilutive to the Company’s
diluted EPS. The following table is a reconciliation of the numerators and denominators of the basic and diluted
EPS computations:
Year Ended December 31,
(in millions, except per share amounts) 2007 2006 2005
Numerator:
Net income (loss) .................................................... $ 73.2 $ 86.3 $ (64.5)
Preferred stock dividends .............................................. 10.4 10.4 10.4
Numerator for basic and diluted EPS ..................................... $ 62.8 $ 75.9 $ (74.9)
Denominator:
Denominator for basic EPS — weighted average common shares outstanding .... 247.4 246.8 245.9
Warrants ........................................................... 7.1 5.1 —
Stock-based compensation arrangements ................................. 2.3 1.4 —
Denominator for diluted EPS ........................................... 256.8 253.3 245.9
Basic earnings (loss) per common share .................................... $ 0.25 $ 0.31 $ (0.30)
Diluted earnings (loss) per common share ................................... $ 0.24 $ 0.30 $ (0.30)
Potentially issuable common shares excluded from denominator for diluted EPS due
to anti-dilutive effect ................................................. 36.5 37.7 45.0
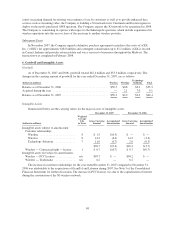
3. Restructuring Charges
2007 Restructurings
In the fourth quarter of 2007, the Company announced a restructuring plan to reduce costs and increase
operational efficiencies. As a result, the Company incurred a restructuring charge of $37.5 million, composed of
the following:
•Special termination pension and postretirement benefit of $8.2 million — The Company offered and, by
December 31, 2007, 105 management employees accepted special termination benefits totaling $12
million. The Company determined that $8.2 million of these benefits have been earned through
December 31, 2007 under SFAS No. 88, “Employers’ Accounting for Settlements and Curtailments of
Defined Benefit Pension Plans and for Termination Benefits,” and this amount was therefore accrued as of
December 31, 2007. Remaining termination benefits are subject to future service requirements as
determined by the Company and will be amortized to expense over the future service period. The
Company estimates these amounts to be approximately $2.6 million in 2008 and $1.2 million in 2009. See
Note 9 to the Consolidated Financial Statements for further discussion of the special termination benefits.
•Employee separation costs of $22.9 million — This represents severance costs for employees over the
next five years that are primarily related to the Company’s need to downsize its Wireline operations to
conform to the decreased access lines being served by the Company. These costs were recorded in
accordance with SFAS No. 112, “Employers’ Accounting for Postemployment Benefits, an Amendment
of FASB Statements No. 5 and 43,” as the Company has probable and estimable liabilities under its
written severance plans.
•Pension and postretirement curtailment charge of $6.4 million — Management terminations contemplated
above represent approximately 10% of the plan service years for the management pension plan and 15%
of the plan service years for the management postretirement benefits plan, resulting in a pension and
postretirement plans curtailment charge of $6.4 million. See Note 9 to the Consolidated Financial
Statements for further discussion relating to the curtailment charge.
63
Form 10-K