Cincinnati Bell 2007 Annual Report Download - page 167
Download and view the complete annual report
Please find page 167 of the 2007 Cincinnati Bell annual report below. You can navigate through the pages in the report by either clicking on the pages listed below, or by using the keyword search tool below to find specific information within the annual report.-
 1
1 -
2
-
3
-
4
-
5
-
6
-
7
-
8
-
9
-
10
-
11
-
12
-
13
-
14
-
15
-
16
-
17
-
18
-
19
-
20
-
21
-
22
-
23
-
24
-
25
-
26
-
27
-
28
-
29
-
30
-
31
-
32
-
33
-
34
-
35
-
36
-
37
-
38
-
39
-
40
-
41
-
42
-
43
-
44
-
45
-
46
-
47
-
48
-
49
-
50
-
51
-
52
-
53
-
54
-
55
-
56
-
57
-
58
-
59
-
60
-
61
-
62
-
63
-
64
-
65
-
66
-
67
-
68
-
69
-
70
-
71
-
72
-
73
-
74
-
75
-
76
-
77
-
78
-
79
-
80
-
81
-
82
-
83
-
84
-
85
-
86
-
87
-
88
-
89
-
90
-
91
-
92
-
93
-
94
-
95
-
96
-
97
-
98
-
99
-
100
-
101
-
102
-
103
-
104
-
105
-
106
-
107
-
108
-
109
-
110
-
111
-
112
-
113
-
114
-
115
-
116
-
117
-
118
-
119
-
120
-
121
-
122
-
123
-
124
-
125
-
126
-
127
-
128
-
129
-
130
-
131
-
132
-
133
-
134
-
135
-
136
-
137
-
138
-
139
-
140
-
141
-
142
-
143
-
144
-
145
-
146
-
147
-
148
-
149
-
150
-
151
-
152
-
153
-
154
-
155
-
156
-
 157
157 -
 158
158 -
 159
159 -
 160
160 -
 161
161 -
 162
162 -
 163
163 -
 164
164 -
 165
165 -
 166
166 -
 167
167 -
 168
168 -
 169
169 -
 170
170 -
 171
171 -
 172
172 -
 173
173 -
 174
174 -
 175
175 -
 176
176 -
 177
177 -
178
-
179
-
180
-
181
-
182
-
183
-
184
-
185
-
186
-
187
-
188
-
189
-
190
-
191
-
192
 |
 |

exercise price was greater than the closing market price on December 30, 2005 of the Company’s common stock.
The Company also immediately vested 1,673,700 options that were granted in December 2005. Restrictions were
placed on the December 2005 option grant, such that the recipient’s right to sell any shares obtained upon
exercise of the options was limited to 28% upon the first anniversary of the grant, and an additional 3% per
month in each of the 24 months thereafter. These selling restrictions do not represent a substantive service
period, and the restrictions lapse in the event that the option holder’s employment with the Company terminates.
As a result of the vesting of all out-of-the-money options and the December 2005 grant, the Company estimated
that the impact on pro forma expense was $3.4 million, net of tax, in 2005. This amount was included in the pro
forma stock based compensation expense as disclosed in Note 1.
The decision to accelerate the vesting of the out-of-the-money options and to fully vest the December 2005
option grant was made primarily to reduce compensation expense that otherwise would have been recorded in
future periods following the Company’s adoption in 2006 of SFAS No. 123(R). The Company believes this
action further enhanced management’s focus on shareholder return and was in the best interest of the Company’s
shareholders.
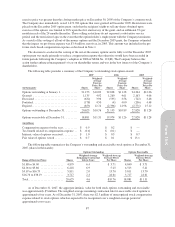
The following table provides a summary of the Company’s outstanding stock option awards:
2007 2006 2005
(in thousands) Shares
Weighted-
Average
Exercise
Prices Per
Share Shares
Weighted-
Average
Exercise
Prices Per
Share Shares
Weighted-
Average
Exercise
Prices Per
Share
Options outstanding at January 1, ........... 21,153 $10.89 22,828 $11.28 24,364 $12.06
Granted ............................... 1,135 4.92 1,260 4.61 2,163 4.06
Exercised .............................. (632) 3.96 (535) 3.56 (722) 3.48
Forfeited ............................... (178) 4.50 (4) 4.00 (206) 4.48
Expired ................................ (853) 12.74 (2,396) 12.96 (2,771) 15.12
Options outstanding at December 31, ........ 20,625 $10.76 21,153 $10.89 22,828 $11.28
Options exercisable at December 31, ........ 18,881 $11.31 19,974 $11.26 22,828 $11.28
(in millions)
Compensation expense for the year .......... $ 0.9 $ 0.2 $ —
Tax benefit related to compensation expense . . $ (0.4) $ (0.1) $ —
Intrinsic value of options exercised .......... $ 1.0 $ 0.5 $ 0.7
Fair value of options vested ................ $ 0.7 $ 0.1 $ 13.1
The following table summarizes the Company’s outstanding and exercisable stock options at December 31,
2007 (shares in thousands):
Options Outstanding Options Exercisable
Range of Exercise Prices Shares
Weighted-Average
Remaining Contractual
Life in Years
Weighted-Average
Exercise Prices
Per Share Shares
Weighted-Average
Exercise Prices
Per Share
$1.88 to $4.00 ................ 4,879 6.4 $ 3.71 4,840 $ 3.71
$4.01 to $5.66 ................ 6,218 6.9 5.25 4,513 5.41
$5.67 to $16.75 ............... 5,811 2.0 13.70 5,811 13.70
$16.76 to $38.19 .............. 3,717 2.3 24.61 3,717 24.61
Total ........................ 20,625 4.6 $10.76 18,881 $11.31
As of December 31, 2007, the aggregate intrinsic value for both stock options outstanding and exercisable
was approximately $5 million. The weighted-average remaining contractual life for exercisable stock options is
approximately four years. As of December 31, 2007, there was $2.5 million of unrecognized stock compensation
expense related to stock options, which is expected to be recognized over a weighted-average period of
approximately two years.
87
Form 10-K