Cincinnati Bell 2007 Annual Report Download - page 172
Download and view the complete annual report
Please find page 172 of the 2007 Cincinnati Bell annual report below. You can navigate through the pages in the report by either clicking on the pages listed below, or by using the keyword search tool below to find specific information within the annual report.-
 1
1 -
2
-
3
-
4
-
5
-
6
-
7
-
8
-
9
-
10
-
11
-
12
-
13
-
14
-
15
-
16
-
17
-
18
-
19
-
20
-
21
-
22
-
23
-
24
-
25
-
26
-
27
-
28
-
29
-
30
-
31
-
32
-
33
-
34
-
35
-
36
-
37
-
38
-
39
-
40
-
41
-
42
-
43
-
44
-
45
-
46
-
47
-
48
-
49
-
50
-
51
-
52
-
53
-
54
-
55
-
56
-
57
-
58
-
59
-
60
-
61
-
62
-
63
-
64
-
65
-
66
-
67
-
68
-
69
-
70
-
71
-
72
-
73
-
74
-
75
-
76
-
77
-
78
-
79
-
80
-
81
-
82
-
83
-
84
-
85
-
86
-
87
-
88
-
89
-
90
-
91
-
92
-
93
-
94
-
95
-
96
-
97
-
98
-
99
-
100
-
101
-
102
-
103
-
104
-
105
-
106
-
107
-
108
-
109
-
110
-
111
-
112
-
113
-
114
-
115
-
116
-
117
-
118
-
119
-
120
-
121
-
122
-
123
-
124
-
125
-
126
-
127
-
128
-
129
-
130
-
131
-
132
-
133
-
134
-
135
-
136
-
137
-
138
-
139
-
140
-
141
-
142
-
143
-
144
-
145
-
146
-
147
-
148
-
149
-
150
-
151
-
152
-
153
-
154
-
155
-
156
-
157
-
158
-
159
-
160
-
161
-
 162
162 -
 163
163 -
 164
164 -
 165
165 -
 166
166 -
 167
167 -
 168
168 -
 169
169 -
 170
170 -
 171
171 -
 172
172 -
 173
173 -
 174
174 -
 175
175 -
 176
176 -
 177
177 -
 178
178 -
 179
179 -
 180
180 -
 181
181 -
 182
182 -
183
-
184
-
185
-
186
-
187
-
188
-
189
-
190
-
191
-
192
 |
 |

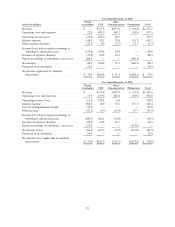
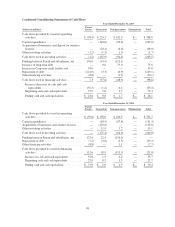
Year Ended December 31, 2006
(dollars in millions)
Parent
(Guarantor) CBT
Other
(Non-guarantors) Eliminations Total
Revenue ................................ $ — $747.3 $557.6 $ (34.8) $1,270.1
Operating costs and expenses ............... 22.0 481.3 489.1 (34.8) 957.6
Operating income (loss) .................... (22.0) 266.0 68.5 — 312.5
Interest expense .......................... 146.1 15.1 32.6 (31.7) 162.1
Other expense (income) .................... (32.5) 0.3 (3.7) 31.7 (4.2)
Income (loss) before equity in earnings of
subsidiaries and income taxes ............. (135.6) 250.6 39.6 — 154.6
Income tax expense (benefit) ................ (35.8) 89.8 14.3 — 68.3
Equity in earnings of subsidiaries, net of tax .... 186.1 — — (186.1) —
Net income .............................. 86.3 160.8 25.3 (186.1) 86.3
Preferred stock dividends ................... 10.4 — — — 10.4
Net income applicable to common
shareowners ........................... $ 75.9 $160.8 $ 25.3 $(186.1) $ 75.9
Year Ended December 31, 2005
Parent
(Guarantor) CBT
Other
(Non-guarantors) Eliminations Total
Revenue ................................ $ — $755.6 $487.9 $ (33.9) $1,209.6
Operating costs and expenses ............... 17.9 479.5 487.3 (33.9) 950.8
Operating income (loss) .................... (17.9) 276.1 0.6 — 258.8
Interest expense .......................... 168.0 16.9 37.2 (37.7) 184.4
Loss on extinguishment of debt .............. 99.8 — — — 99.8
Other income ............................ (25.2) (5.9) (21.8) 37.7 (15.2)
Income (loss) before equity in earnings of
subsidiaries and income taxes ............. (260.5) 265.1 (14.8) — (10.2)
Income tax expense (benefit) ................ (82.2) 99.8 36.7 — 54.3
Equity in earnings of subsidiaries, net of tax .... 113.8 — — (113.8) —
Net income (loss) ......................... (64.5) 165.3 (51.5) (113.8) (64.5)
Preferred stock dividends ................... 10.4 — — — 10.4
Net income (loss) applicable to common
shareowners ........................... $ (74.9) $165.3 $ (51.5) $(113.8) $ (74.9)
92