Cincinnati Bell 2007 Annual Report Download - page 109
Download and view the complete annual report
Please find page 109 of the 2007 Cincinnati Bell annual report below. You can navigate through the pages in the report by either clicking on the pages listed below, or by using the keyword search tool below to find specific information within the annual report.-
 1
1 -
2
-
3
-
4
-
5
-
6
-
7
-
8
-
9
-
10
-
11
-
12
-
13
-
14
-
15
-
16
-
17
-
18
-
19
-
20
-
21
-
22
-
23
-
24
-
25
-
26
-
27
-
28
-
29
-
30
-
31
-
32
-
33
-
34
-
35
-
36
-
37
-
38
-
39
-
40
-
41
-
42
-
43
-
44
-
45
-
46
-
47
-
48
-
49
-
50
-
51
-
52
-
53
-
54
-
55
-
56
-
57
-
58
-
59
-
60
-
61
-
62
-
63
-
64
-
65
-
66
-
67
-
68
-
69
-
70
-
71
-
72
-
73
-
74
-
75
-
76
-
77
-
78
-
79
-
80
-
81
-
82
-
83
-
84
-
85
-
86
-
87
-
88
-
89
-
90
-
91
-
92
-
93
-
94
-
95
-
96
-
97
-
98
-
 99
99 -
 100
100 -
 101
101 -
 102
102 -
 103
103 -
 104
104 -
 105
105 -
 106
106 -
 107
107 -
 108
108 -
 109
109 -
 110
110 -
 111
111 -
 112
112 -
 113
113 -
 114
114 -
 115
115 -
 116
116 -
 117
117 -
 118
118 -
 119
119 -
120
-
121
-
122
-
123
-
124
-
125
-
126
-
127
-
128
-
129
-
130
-
131
-
132
-
133
-
134
-
135
-
136
-
137
-
138
-
139
-
140
-
141
-
142
-
143
-
144
-
145
-
146
-
147
-
148
-
149
-
150
-
151
-
152
-
153
-
154
-
155
-
156
-
157
-
158
-
159
-
160
-
161
-
162
-
163
-
164
-
165
-
166
-
167
-
168
-
169
-
170
-
171
-
172
-
173
-
174
-
175
-
176
-
177
-
178
-
179
-
180
-
181
-
182
-
183
-
184
-
185
-
186
-
187
-
188
-
189
-
190
-
191
-
192
 |
 |

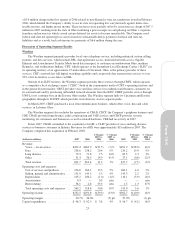
Technology Solutions
The Technology Solutions segment provides business technology solutions through the Company’s
subsidiary, Cincinnati Bell Technology Solutions, Inc. (“CBTS”) and GramTel, which was purchased on
December 31, 2007. See Note 5 to the Consolidated Financial Statements for further discussion.
(dollars in millions) 2007 2006
$ Change
2007 vs.
2006
% Change
2007 vs.
2006 2005
$ Change
2006 vs.
2005
% Change
2006 vs.
2005
Revenue:
Telecom and IT equipment
distribution .................... $180.8 $162.2 $18.6 11% $126.7 $35.5 28%
Data center and managed services .... 67.6 47.4 20.2 43% 37.1 10.3 28%
Professional services .............. 9.9 7.0 2.9 41% 8.9 (1.9) (21)%
Total revenue .................... 258.3 216.6 41.7 19% 172.7 43.9 25%
Operating costs and expenses:
Cost of services and products ....... 204.6 175.2 29.4 17% 139.5 35.7 26%
Selling, general and administrative . . . 27.2 21.9 5.3 24% 17.4 4.5 26%
Depreciation .................... 7.0 3.4 3.6 n/m 2.3 1.1 48%
Amortization .................... 0.4 0.3 0.1 33% — 0.3 n/m
Restructuring .................... 1.0 — 1.0 n/m 0.1 (0.1) (100)%
Total operating costs and expenses . . . 240.2 200.8 39.4 20% 159.3 41.5 26%
Operating income .................. $ 18.1 $ 15.8 $ 2.3 15% $ 13.4 $ 2.4 18%
Operating margin ................... 7.0% 7.3% 0 pts 7.8% (1) pts
Capital expenditures ................ $ 91.8 $ 11.2 $80.6 n/m $ 7.2 $ 4.0 56%
2007 Compared to 2006
Revenue
Revenue from telecom and IT equipment distribution represents the sale, installation, and maintenance of
major, branded IT and telephony equipment. The increased data center customers have given rise to increased
revenue associated with IT and telephony equipment. Revenue from telecom and IT equipment distribution
increased by $18.6 million in 2007 versus 2006 primarily as a result of increased equipment sales of $15.6
million and higher installation and maintenance services.
Data center and managed services revenue consists of recurring collocation rents from customers residing in
the Company’s data centers, managed VOIP Solutions and IT services that include network management,
electronic data storage, disaster recovery and data security management. Revenue increased $20.2 million in
2007 as compared to the same period a year ago primarily due to increased product penetration within managed
services and increased billable data center space. Data center billed utilization at December 31, 2007 was 93% on
approximately 144,000 square feet of data center capacity, which includes 13,000 square feet of data center
capacity due to the acquisition of GramTel, compared to billed utilization of 91% on approximately 91,000
square feet of data center capacity at December 31, 2006. Substantially all of the Technology Solutions capital
expenditures in 2007 were to build data center capacity. The Company intends to continue to pursue additional
customers and growth in its data center business, and is prepared to commit additional resources, including
capital expenditures and working capital, to support this growth.
Professional services revenue consists of long-term and short-term IT outsourcing and consulting
engagements. Revenue for 2007 increased by $2.9 million compared to 2006. Early in 2007, the Company
expanded its team of recruiting and hiring personnel in order to focus on selling these outsourcing and consulting
engagements.
29
Form 10-K