Cincinnati Bell 2007 Annual Report Download - page 105
Download and view the complete annual report
Please find page 105 of the 2007 Cincinnati Bell annual report below. You can navigate through the pages in the report by either clicking on the pages listed below, or by using the keyword search tool below to find specific information within the annual report.-
 1
1 -
2
-
3
-
4
-
5
-
6
-
7
-
8
-
9
-
10
-
11
-
12
-
13
-
14
-
15
-
16
-
17
-
18
-
19
-
20
-
21
-
22
-
23
-
24
-
25
-
26
-
27
-
28
-
29
-
30
-
31
-
32
-
33
-
34
-
35
-
36
-
37
-
38
-
39
-
40
-
41
-
42
-
43
-
44
-
45
-
46
-
47
-
48
-
49
-
50
-
51
-
52
-
53
-
54
-
55
-
56
-
57
-
58
-
59
-
60
-
61
-
62
-
63
-
64
-
65
-
66
-
67
-
68
-
69
-
70
-
71
-
72
-
73
-
74
-
75
-
76
-
77
-
78
-
79
-
80
-
81
-
82
-
83
-
84
-
85
-
86
-
87
-
88
-
89
-
90
-
91
-
92
-
93
-
94
-
 95
95 -
 96
96 -
 97
97 -
 98
98 -
 99
99 -
 100
100 -
 101
101 -
 102
102 -
 103
103 -
 104
104 -
 105
105 -
 106
106 -
 107
107 -
 108
108 -
 109
109 -
 110
110 -
 111
111 -
 112
112 -
 113
113 -
 114
114 -
 115
115 -
116
-
117
-
118
-
119
-
120
-
121
-
122
-
123
-
124
-
125
-
126
-
127
-
128
-
129
-
130
-
131
-
132
-
133
-
134
-
135
-
136
-
137
-
138
-
139
-
140
-
141
-
142
-
143
-
144
-
145
-
146
-
147
-
148
-
149
-
150
-
151
-
152
-
153
-
154
-
155
-
156
-
157
-
158
-
159
-
160
-
161
-
162
-
163
-
164
-
165
-
166
-
167
-
168
-
169
-
170
-
171
-
172
-
173
-
174
-
175
-
176
-
177
-
178
-
179
-
180
-
181
-
182
-
183
-
184
-
185
-
186
-
187
-
188
-
189
-
190
-
191
-
192
 |
 |

related to the evaluation of marketing strategies for business customers. The Company is responding to
competitive pressures by increasing its sales and marketing activities, particularly in the business markets.
Restructuring expenses for 2007 were primarily due to the restructuring plan announced in the fourth quarter
of 2007 to reduce costs and increase operational efficiencies. Restructuring costs for 2006 primarily related to the
outsourcing of certain supply chain functions. See Note 3 to the Consolidated Financial Statements for further
discussions.
2006 Compared to 2005
Revenue
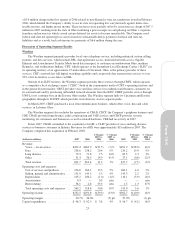
Voice revenue decreased in 2006 compared to 2005 primarily as a result of a 5% decrease in access lines.
Access lines within the segment’s ILEC territory decreased by 56,000, or 6%, from 893,000 at
December 31, 2005 to 837,000 at December 31, 2006, which the Company believes results from several factors
including customers electing to use wireless communication in lieu of the traditional local service, Company-
initiated disconnections of customers with credit problems, and customers electing to use service from other
providers. The Company has partially offset its access line loss in its ILEC service territory by targeting voice
services to residential and small business customers in Dayton, Ohio. The Company had 50,000 total access lines
outside its ILEC service territory at December 31, 2006, a 33% increase from the prior year.
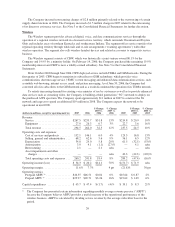
The increase in data revenue of $19.0 million for 2006 as compared to 2005 is due to higher DSL revenue
and data transport revenue. An increase in DSL subscribers of 36,000, partially offset by a slightly lower average
rate per subscriber, produced an additional $11.9 million in revenue for 2006 as compared to 2005. Data
transport revenues were $5.2 million higher in 2006 as compared to 2005 due to higher data usage by CBW and
third party users. As of December 31, 2006, the Company’s DSL penetration of in-territory primary consumer
access lines was approximately 34%, up from 26% at December 31, 2005.
Long distance revenue increased $2.3 million in 2006 compared to 2005. The increase was primarily due to
new dedicated access business customers and a 28% increase in minutes of use for audio conferencing. The
Company had approximately 552,000 subscribed long distance access lines as of December 31, 2006, a decrease
of 12,000 lines compared to 2005. The decrease in subscribers from 2005 was related to a 4% decline in
residential subscribers, consistent with the access line loss, partially offset by a 4% increase in business
subscribers.
The Company added 23,000 Super Bundle subscribers during 2006, bringing total subscribers to 173,000, of
which 162,000 were consumer ILEC subscribers, a 32% penetration of primary in-territory consumer access
lines. An aggressive marketing campaign and the favorable bundled pricing associated with Custom
ConnectionsSM “Super Bundle” increased the demand for the Company’s ZoomTown DSL offering, growing
22% compared to December 31, 2005, to 198,000 subscribers. As a result of this growth, total lines to the
customer (defined as access lines plus DSL subscribers) as of December 31, 2006 decreased only slightly
compared to December 31, 2005, and revenue per household increased 3% to $50.25.
Costs and Expenses
Cost of services and products increased by $4.0 million in 2006 versus 2005. The increase was mainly due
to a $3.5 million increase in non-recurring operating taxes, additional network costs of $4.5 million primarily
related to the increase in subscribers in the CLEC operating area and increased minutes of use for long-distance
and audio conferencing, and an increase of $1.3 million in benefit expense. These increases were partially offset
by lower wages of $4.5 million resulting from the outsourcing of directory services in 2005 and other Company
restructuring initiatives.
Selling, general and administrative expenses increased $2.2 million compared to 2005. Higher costs of $2.9
million primarily related to pension and postretirement costs and $0.9 million for bad debt expense were partially
offset by lower software maintenance and insurance costs.
Depreciation expense decreased $3.9 million in 2006 compared to 2005. The decrease was primarily due to
assets becoming fully depreciated at a greater rate than capital expenditures.
25
Form 10-K