Cincinnati Bell 2007 Annual Report Download - page 169
Download and view the complete annual report
Please find page 169 of the 2007 Cincinnati Bell annual report below. You can navigate through the pages in the report by either clicking on the pages listed below, or by using the keyword search tool below to find specific information within the annual report.-
 1
1 -
2
-
3
-
4
-
5
-
6
-
7
-
8
-
9
-
10
-
11
-
12
-
13
-
14
-
15
-
16
-
17
-
18
-
19
-
20
-
21
-
22
-
23
-
24
-
25
-
26
-
27
-
28
-
29
-
30
-
31
-
32
-
33
-
34
-
35
-
36
-
37
-
38
-
39
-
40
-
41
-
42
-
43
-
44
-
45
-
46
-
47
-
48
-
49
-
50
-
51
-
52
-
53
-
54
-
55
-
56
-
57
-
58
-
59
-
60
-
61
-
62
-
63
-
64
-
65
-
66
-
67
-
68
-
69
-
70
-
71
-
72
-
73
-
74
-
75
-
76
-
77
-
78
-
79
-
80
-
81
-
82
-
83
-
84
-
85
-
86
-
87
-
88
-
89
-
90
-
91
-
92
-
93
-
94
-
95
-
96
-
97
-
98
-
99
-
100
-
101
-
102
-
103
-
104
-
105
-
106
-
107
-
108
-
109
-
110
-
111
-
112
-
113
-
114
-
115
-
116
-
117
-
118
-
119
-
120
-
121
-
122
-
123
-
124
-
125
-
126
-
127
-
128
-
129
-
130
-
131
-
132
-
133
-
134
-
135
-
136
-
137
-
138
-
139
-
140
-
141
-
142
-
143
-
144
-
145
-
146
-
147
-
148
-
149
-
150
-
151
-
152
-
153
-
154
-
155
-
156
-
157
-
158
-
 159
159 -
 160
160 -
 161
161 -
 162
162 -
 163
163 -
 164
164 -
 165
165 -
 166
166 -
 167
167 -
 168
168 -
 169
169 -
 170
170 -
 171
171 -
 172
172 -
 173
173 -
 174
174 -
 175
175 -
 176
176 -
 177
177 -
 178
178 -
 179
179 -
180
-
181
-
182
-
183
-
184
-
185
-
186
-
187
-
188
-
189
-
190
-
191
-
192
 |
 |

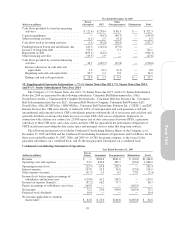
Corporate operating income for 2005 included $11.2 million of income due to the reversal of certain
operating tax reserves. Corporate operating income in 2006 included a charge of $6.3 million related to the
settlement of the Company’s shareholder litigation, income from the sale of a bankruptcy claim receivable for
$3.6 million, a $4.7 million gain on sale of broadband fiber assets, and $2.9 million of income from the
expiration of certain warranties and guarantees. The gains associated with the sale of broadband assets and the
expiration of warranties and guarantees are included in “Gain on sale of broadband assets” in the Consolidated
Statements of Operations. Corporate 2007 operating income includes $0.4 million for restructuring charges, as
described in Note 3.
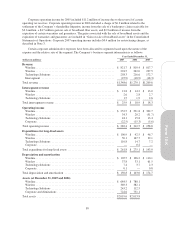
Certain corporate administrative expenses have been allocated to segments based upon the nature of the
expense and the relative size of the segment. The Company’s business segment information is as follows:
Year Ended December 31,
(dollars in millions) 2007 2006 2005
Revenue
Wireline ....................................................... $ 821.7 $ 810.4 $ 817.7
Wireless ....................................................... 294.5 262.0 237.5
Technology Solutions ............................................ 258.3 216.6 172.7
Intersegment ................................................... (25.9) (18.9) (18.3)
Total revenue ..................................................... $1,348.6 $1,270.1 $1,209.6
Intersegment revenue
Wireline ....................................................... $ 21.8 $ 14.2 $ 13.0
Wireless ....................................................... 2.6 2.8 2.7
Technology Solutions ............................................ 1.5 1.9 2.6
Total intersegment revenue .......................................... $ 25.9 $ 18.9 $ 18.3
Operating income
Wireline ....................................................... $ 252.5 $ 291.8 $ 302.7
Wireless ....................................................... 34.3 20.2 (51.7)
Technology Solutions ............................................ 18.1 15.8 13.4
Corporate ...................................................... (22.5) (15.3) (5.6)
Total operating income ............................................. $ 282.4 $ 312.5 $ 258.8
Expenditures for long-lived assets
Wireline ....................................................... $ 100.9 $ 92.5 $ 96.7
Wireless ....................................................... 50.1 167.7 39.1
Technology Solutions ............................................ 110.8 14.7 7.2
Corporate ...................................................... — 0.2 —
Total expenditure for long-lived assets ................................. $ 261.8 $ 275.1 $ 143.0
Depreciation and amortization
Wireline ....................................................... $ 105.5 $ 106.2 $ 110.1
Wireless ....................................................... 37.8 33.1 61.5
Technology Solutions ............................................ 7.4 3.7 2.3
Corporate ...................................................... 0.1 — 0.8
Total depreciation and amortization ................................... $ 150.8 $ 143.0 $ 174.7
Assets (at December 31, 2007 and 2006)
Wireline ....................................................... $ 684.5 $ 788.1
Wireless ....................................................... 369.3 382.1
Technology Solutions ............................................ 243.2 112.5
Corporate and eliminations ........................................ 722.6 731.1
Total assets ...................................................... $2,019.6 $2,013.8
89
Form 10-K