Cincinnati Bell 2007 Annual Report Download - page 170
Download and view the complete annual report
Please find page 170 of the 2007 Cincinnati Bell annual report below. You can navigate through the pages in the report by either clicking on the pages listed below, or by using the keyword search tool below to find specific information within the annual report.-
 1
1 -
2
-
3
-
4
-
5
-
6
-
7
-
8
-
9
-
10
-
11
-
12
-
13
-
14
-
15
-
16
-
17
-
18
-
19
-
20
-
21
-
22
-
23
-
24
-
25
-
26
-
27
-
28
-
29
-
30
-
31
-
32
-
33
-
34
-
35
-
36
-
37
-
38
-
39
-
40
-
41
-
42
-
43
-
44
-
45
-
46
-
47
-
48
-
49
-
50
-
51
-
52
-
53
-
54
-
55
-
56
-
57
-
58
-
59
-
60
-
61
-
62
-
63
-
64
-
65
-
66
-
67
-
68
-
69
-
70
-
71
-
72
-
73
-
74
-
75
-
76
-
77
-
78
-
79
-
80
-
81
-
82
-
83
-
84
-
85
-
86
-
87
-
88
-
89
-
90
-
91
-
92
-
93
-
94
-
95
-
96
-
97
-
98
-
99
-
100
-
101
-
102
-
103
-
104
-
105
-
106
-
107
-
108
-
109
-
110
-
111
-
112
-
113
-
114
-
115
-
116
-
117
-
118
-
119
-
120
-
121
-
122
-
123
-
124
-
125
-
126
-
127
-
128
-
129
-
130
-
131
-
132
-
133
-
134
-
135
-
136
-
137
-
138
-
139
-
140
-
141
-
142
-
143
-
144
-
145
-
146
-
147
-
148
-
149
-
150
-
151
-
152
-
153
-
154
-
155
-
156
-
157
-
158
-
159
-
 160
160 -
 161
161 -
 162
162 -
 163
163 -
 164
164 -
 165
165 -
 166
166 -
 167
167 -
 168
168 -
 169
169 -
 170
170 -
 171
171 -
 172
172 -
 173
173 -
 174
174 -
 175
175 -
 176
176 -
 177
177 -
 178
178 -
 179
179 -
 180
180 -
181
-
182
-
183
-
184
-
185
-
186
-
187
-
188
-
189
-
190
-
191
-
192
 |
 |

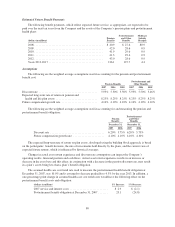
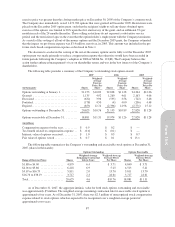
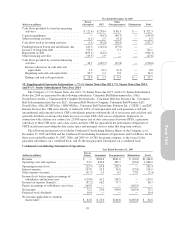
Details of the Company’s service and product revenues are as follows:
Year Ended December 31,
(dollars in millions) 2007 2006 2005
Service revenue
Wireline ............................................ $ 782.6 $ 785.1 $ 793.9
Wireless ............................................ 265.1 233.1 212.4
Managed and data center services ........................ 67.6 47.4 37.1
Telephony installation and maintenance ................... 26.2 23.7 20.1
Other .............................................. 13.9 10.9 13.4
Total service revenue ................................... $1,155.4 $1,100.2 $1,076.9
Product revenue
Handsets and accessories .............................. $ 26.8 $ 26.1 $ 22.4
IT and computer-related equipment ...................... 124.8 111.5 80.2
Telephony and other equipment ......................... 41.6 32.3 30.1
Total product revenue ................................... $ 193.2 $ 169.9 $ 132.7
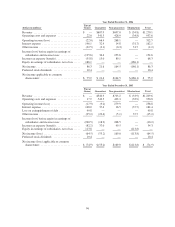
The reconciliation of the Consolidated Statement of Cash Flows to expenditures for long-lived assets is as
follows:
Year Ended December 31,
(dollars in millions) 2007 2006 2005
Per Consolidated Statement of Cash Flows:
Capital expenditures ..................................... $233.8 $151.3 $143.0
Acquisitions of businesses and remaining minority interest in
CBW............................................... 23.6 86.7 —
Purchase and deposit — wireless licenses .................... 4.4 37.1 —
Total expenditure for long-lived assets .......................... $261.8 $275.1 $143.0
16. Supplemental Cash Flow Information
Year ended December 31,
(dollars in millions) 2007 2006 2005
Capitalized interest expense ................................... $ 3.6 $ 1.0 $ 0.6
Cash paid for:
Interest ................................................. 156.5 153.7 155.1
Income taxes (net of refunds) ................................ 6.6 6.6 2.1
Noncash investing and financing activities:
Increase in assets and liabilities due to capital lease transactions .... 9.0 5.2 11.4
Noncash operating and investing activities:
Increase in assets and liabilities related to capital expenditures not
yet paid ............................................... 9.7 0.3 0.2
90