Cincinnati Bell 2005 Annual Report Download - page 78
Download and view the complete annual report
Please find page 78 of the 2005 Cincinnati Bell annual report below. You can navigate through the pages in the report by either clicking on the pages listed below, or by using the keyword search tool below to find specific information within the annual report.-
 1
1 -
2
-
3
-
4
-
5
-
6
-
7
-
8
-
9
-
10
-
11
-
12
-
13
-
14
-
15
-
16
-
17
-
18
-
19
-
20
-
21
-
22
-
23
-
24
-
25
-
26
-
27
-
28
-
29
-
30
-
31
-
32
-
33
-
34
-
35
-
36
-
37
-
38
-
39
-
40
-
41
-
42
-
43
-
44
-
45
-
46
-
47
-
48
-
49
-
50
-
51
-
52
-
53
-
54
-
55
-
56
-
57
-
58
-
59
-
60
-
61
-
62
-
63
-
64
-
65
-
66
-
67
-
 68
68 -
 69
69 -
 70
70 -
 71
71 -
 72
72 -
 73
73 -
 74
74 -
 75
75 -
 76
76 -
 77
77 -
 78
78 -
 79
79 -
 80
80 -
 81
81 -
 82
82 -
 83
83 -
 84
84 -
 85
85 -
 86
86 -
 87
87 -
 88
88 -
89
-
90
-
91
-
92
-
93
-
94
-
95
-
96
-
97
-
98
-
99
-
100
-
101
-
102
-
103
-
104
-
105
-
106
-
107
-
108
-
109
-
110
-
111
-
112
-
113
-
114
-
115
-
116
-
117
-
118
-
119
-
120
-
121
-
122
-
123
-
124
-
125
-
126
-
127
-
128
-
129
-
130
-
131
-
132
-
133
-
134
-
135
-
136
-
137
-
138
-
139
-
140
-
141
-
142
-
143
-
144
-
145
-
146
-
147
-
148
-
149
-
150
-
151
-
152
-
153
-
154
-
155
-
156
-
157
-
158
-
159
-
160
-
161
-
162
-
163
-
164
-
165
-
166
-
167
-
168
-
169
-
170
-
171
-
172
 |
 |

Depreciation expense of $58.3 million increased $20.0 million in 2004 compared to 2003. The increase was
a result of $20.6 million in additional depreciation related to the change in estimated economic useful life of the
TDMA network to December 31, 2006.
Amortization expense of $9.1 million increased $8.6 million in 2004 compared to 2003. The increase was a
result of $7.4 million in accelerated amortization related to the shortened, estimated economic useful lives of
certain AWE roaming and trade name agreements, as a result of the merger between Cingular Wireless and
AWE, consummated on October 26, 2004.
Asset impairment charges of $5.9 million in 2004 were comprised of $3.5 million recorded to write-down
certain TDMA assets, which CBW removed from service, and a $2.4 million asset impairment charge related to
certain intangible assets.
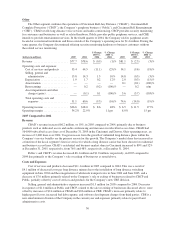
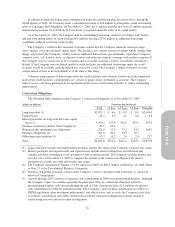
Hardware and Managed Services
The Hardware and Managed Services segment provides data center collocation, IT consulting services,
telecommunications and computer equipment as well as related installation and maintenance. The Hardware and
Managed Services is comprised of the operations within CBTS. In March 2004, CBTS sold certain operating
assets, which were generally residing outside of the Company’s operating area, for approximately $3.2 million in
cash. During the second quarter of 2004, CBTS paid $1.3 million to the buyer of the assets in working capital
adjustments related to the sale.
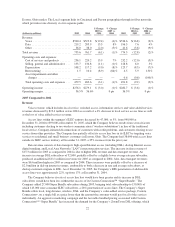
(dollars in millions) 2005 2004
$ Change
2005 vs.
2004
% Change
2005 vs.
2004 2003
$ Change
2004 vs.
2003
% Change
2004 vs.
2003
Revenue:
Hardware ....................... $106.6 $ 74.0 $32.6 44% $ 89.6 $(15.6) (17)%
Managed services ................ 66.1 60.7 5.4 9% 73.2 (12.5) (17)%
Total revenue .................... 172.7 134.7 38.0 28% 162.8 (28.1) (17)%
Operating costs and expenses:
Cost of services and products ....... 139.5 104.7 34.8 33% 121.4 (16.7) (14)%
Selling, general and administrative . . . 17.4 16.7 0.7 4% 24.3 (7.6) (31)%
Depreciation .................... 2.3 1.1 1.2 109% 0.7 0.4 57%
Restructuring .................... 0.1 0.6 (0.5) (83)% — 0.6 n/m
Asset impairments and other charges
(gains) ....................... — (1.1) 1.1 (100)% (1.1) — —
Total operating costs and expenses . . . 159.3 122.0 37.3 31% 145.3 (23.3) (16)%
Operating income .................. $ 13.4 $ 12.7 $ 0.7 6% $ 17.5 $ (4.8) (27)%
Operating margin ................... 7.8% 9.4% (2) pts 10.7% (1) pt
2005 Compared to 2004
Revenue
Hardware revenue is generated by the reselling of major manufacturers’ IT, data and telephony equipment.
Managed services revenue consists of the sale of outsourced technology resources, leveraging assets within the
Company, including but not limited to data center assets, and revenue of technical services and maintenance
directly related to the sale of IT, data and telephony equipment. The CBTS business model links the capability to
sell a wide range of equipment from various manufacturers along with the Company’s technical and
infrastructure capability to offer complete technology solutions for the small, medium, and large business
customer.
In March 2004, CBTS sold certain out-of-territory operations, which negatively impacted 2005 hardware
revenue by $20.7 million. This decrease was more than offset by increased hardware sales from core CBTS
operations. This increase in core CBTS hardware sales was due to a $49.1 million increase in IT and computer-
related hardware revenue, resulting primarily from increased hardware revenue from data center customers.
CBTS expanded its data center business with the purchase of its Mason, Ohio data center in late 2004 and the
28