Cincinnati Bell 2005 Annual Report Download - page 142
Download and view the complete annual report
Please find page 142 of the 2005 Cincinnati Bell annual report below. You can navigate through the pages in the report by either clicking on the pages listed below, or by using the keyword search tool below to find specific information within the annual report.-
 1
1 -
2
-
3
-
4
-
5
-
6
-
7
-
8
-
9
-
10
-
11
-
12
-
13
-
14
-
15
-
16
-
17
-
18
-
19
-
20
-
21
-
22
-
23
-
24
-
25
-
26
-
27
-
28
-
29
-
30
-
31
-
32
-
33
-
34
-
35
-
36
-
37
-
38
-
39
-
40
-
41
-
42
-
43
-
44
-
45
-
46
-
47
-
48
-
49
-
50
-
51
-
52
-
53
-
54
-
55
-
56
-
57
-
58
-
59
-
60
-
61
-
62
-
63
-
64
-
65
-
66
-
67
-
68
-
69
-
70
-
71
-
72
-
73
-
74
-
75
-
76
-
77
-
78
-
79
-
80
-
81
-
82
-
83
-
84
-
85
-
86
-
87
-
88
-
89
-
90
-
91
-
92
-
93
-
94
-
95
-
96
-
97
-
98
-
99
-
100
-
101
-
102
-
103
-
104
-
105
-
106
-
107
-
108
-
109
-
110
-
111
-
112
-
113
-
114
-
115
-
116
-
117
-
118
-
119
-
120
-
121
-
122
-
123
-
124
-
125
-
126
-
127
-
128
-
129
-
130
-
131
-
 132
132 -
 133
133 -
 134
134 -
 135
135 -
 136
136 -
 137
137 -
 138
138 -
 139
139 -
 140
140 -
 141
141 -
 142
142 -
 143
143 -
 144
144 -
 145
145 -
 146
146 -
 147
147 -
 148
148 -
 149
149 -
 150
150 -
 151
151 -
 152
152 -
153
-
154
-
155
-
156
-
157
-
158
-
159
-
160
-
161
-
162
-
163
-
164
-
165
-
166
-
167
-
168
-
169
-
170
-
171
-
172
 |
 |

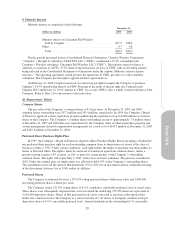
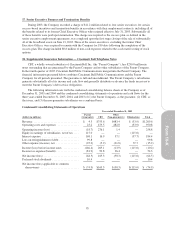
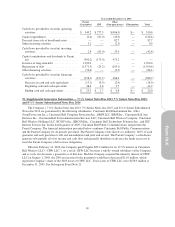
Certain corporate administrative expenses have been allocated to segments based upon the nature of the
expense and the relative size of the segment. The Company’s business segment information is as follows:
Year Ended December 31,
(dollars in millions) 2005 2004 2003
Revenue
Local .............................................. $ 755.6 $ 761.7 $ 774.5
Wireless ............................................ 237.5 261.7 259.5
Hardware and managed services ......................... 172.7 134.7 162.8
Other .............................................. 77.7 78.6 81.1
Broadband .......................................... — — 332.4
Intersegment ........................................ (33.9) (29.6) (52.5)
Total revenue .......................................... $1,209.6 $1,207.1 $1,557.8
Intersegment revenue
Local .............................................. $ 25.6 $ 21.1 $ 27.1
Wireless ............................................ 2.7 2.1 1.1
Hardware and managed services ......................... 2.6 4.5 4.4
Other .............................................. 3.0 1.9 0.6
Broadband .......................................... — — 19.3
Total intersegment revenue ............................... $ 33.9 $ 29.6 $ 52.5
Operating income
Local .............................................. $ 276.1 $ 279.1 $ 282.7
Wireless ............................................ (51.7) (1.4) 60.2
Hardware and managed services ......................... 13.4 12.7 17.5
Other .............................................. 26.6 18.0 6.5
Broadband .......................................... 12.3 10.7 344.5
Corporate and eliminations ............................. (17.9) (19.8) (27.4)
Total operating income .................................. $ 258.8 $ 299.3 $ 684.0
Capital expenditures
Local .............................................. $ 94.3 $ 80.1 $ 81.0
Wireless ............................................ 39.1 32.4 40.2
Hardware and managed services ......................... 7.2 15.6 0.6
Other .............................................. 2.4 5.7 0.9
Broadband .......................................... — — 3.6
Corporate and eliminations ............................. — 0.1 0.1
Total capital expenditures ................................ $ 143.0 $ 133.9 $ 126.4
Depreciation and amortization
Local .............................................. $ 108.2 $ 117.2 $ 125.7
Wireless ............................................ 61.5 67.4 38.8
Hardware and managed services ......................... 2.3 1.1 0.7
Other .............................................. 1.9 1.7 2.1
Broadband .......................................... 0.1 — 1.9
Corporate and eliminations ............................. 0.7 0.3 0.5
Total depreciation and amortization ........................ $ 174.7 $ 187.7 $ 169.7
Assets (at December 31, 2005 and 2004)
Local .............................................. $ 721.4 $ 717.1
Wireless ............................................ 274.2 371.6
Hardware and managed services ......................... 90.7 60.8
Other .............................................. 101.4 124.1
Broadband .......................................... 2.7 2.9
Corporate and eliminations ............................. 672.9 682.2
Total assets ........................................... $1,863.3 $1,958.7
92