Cincinnati Bell 2005 Annual Report Download - page 146
Download and view the complete annual report
Please find page 146 of the 2005 Cincinnati Bell annual report below. You can navigate through the pages in the report by either clicking on the pages listed below, or by using the keyword search tool below to find specific information within the annual report.-
 1
1 -
2
-
3
-
4
-
5
-
6
-
7
-
8
-
9
-
10
-
11
-
12
-
13
-
14
-
15
-
16
-
17
-
18
-
19
-
20
-
21
-
22
-
23
-
24
-
25
-
26
-
27
-
28
-
29
-
30
-
31
-
32
-
33
-
34
-
35
-
36
-
37
-
38
-
39
-
40
-
41
-
42
-
43
-
44
-
45
-
46
-
47
-
48
-
49
-
50
-
51
-
52
-
53
-
54
-
55
-
56
-
57
-
58
-
59
-
60
-
61
-
62
-
63
-
64
-
65
-
66
-
67
-
68
-
69
-
70
-
71
-
72
-
73
-
74
-
75
-
76
-
77
-
78
-
79
-
80
-
81
-
82
-
83
-
84
-
85
-
86
-
87
-
88
-
89
-
90
-
91
-
92
-
93
-
94
-
95
-
96
-
97
-
98
-
99
-
100
-
101
-
102
-
103
-
104
-
105
-
106
-
107
-
108
-
109
-
110
-
111
-
112
-
113
-
114
-
115
-
116
-
117
-
118
-
119
-
120
-
121
-
122
-
123
-
124
-
125
-
126
-
127
-
128
-
129
-
130
-
131
-
132
-
133
-
134
-
135
-
 136
136 -
 137
137 -
 138
138 -
 139
139 -
 140
140 -
 141
141 -
 142
142 -
 143
143 -
 144
144 -
 145
145 -
 146
146 -
 147
147 -
 148
148 -
 149
149 -
 150
150 -
 151
151 -
 152
152 -
 153
153 -
 154
154 -
 155
155 -
 156
156 -
157
-
158
-
159
-
160
-
161
-
162
-
163
-
164
-
165
-
166
-
167
-
168
-
169
-
170
-
171
-
172
 |
 |

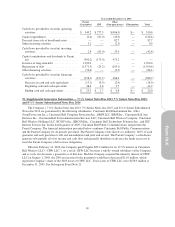
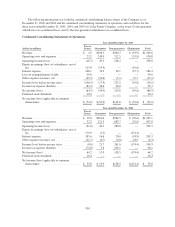
Year ended December 31, 2004
Parent
(Guarantor) CBT
Other
(Non-guarantors) Eliminations Total
Revenue ................................ $ 10.6 $761.7 $ 464.4 $ (29.6) $1,207.1
Operating costs and expenses ............... 32.2 482.6 422.6 (29.6) 907.8
Operating income (loss) .................... (21.6) 279.1 41.8 — 299.3
Equity in earnings of subsidiaries, net of tax .... 176.9 — — (176.9) —
Interest expense .......................... 185.6 17.5 25.5 (25.3) 203.3
Other expense (income), net ................ (21.7) (1.2) (6.7) 25.3 (4.3)
Income (loss) before income taxes ........... (8.6) 262.8 23.0 (176.9) 100.3
Income tax expense (benefit) ................ (72.8) 101.9 7.0 — 36.1
Net income (loss) ......................... 64.2 160.9 16.0 (176.9) 64.2
Preferred stock dividends ................... 10.4 — — — 10.4
Net income (loss) applicable to common
shareowners ........................... $ 53.8 $160.9 $ 16.0 $ (176.9) $ 53.8
Year ended December 31, 2003
Parent
(Guarantor) CBT
Other
(Non-guarantors) Eliminations Total
Revenue ................................ $ 12.8 $820.4 $ 776.5 $ (51.9) $1,557.8
Operating costs and expenses ............... 43.6 524.3 357.8 (51.9) 873.8
Operating income (loss) .................... (30.8) 296.1 418.7 — 684.0
Equity in earnings of subsidiaries, net of tax .... 1,163.0 — — (1,163.0) —
Interest expense .......................... 186.2 20.8 71.2 (60.4) 217.8
Other expense (income), net ................ (27.7) (10.9) 27.2 60.4 49.0
Income (loss) before income taxes and
cumulative effect of change in accounting
principle .............................. 973.7 286.2 320.3 (1,163.0) 417.2
Income tax expense (benefit) ................ (272.3) 95.2 (651.7) — (828.8)
Income (loss) before cumulative effect of change
in accounting principle ................... 1,246.0 191.0 972.0 (1,163.0) 1,246.0
Cumulative effect of change in accounting
principle, net of tax ..................... 85.9 86.3 (0.4) (85.9) 85.9
Net income (loss) ......................... 1,331.9 277.3 971.6 (1,248.9) 1,331.9
Preferred stock dividends ................... 10.4 — — — 10.4
Net income (loss) applicable to common
shareowners ........................... $1,321.5 $277.3 $ 971.6 $(1,248.9) $1,321.5
96