Cincinnati Bell 2005 Annual Report Download - page 147
Download and view the complete annual report
Please find page 147 of the 2005 Cincinnati Bell annual report below. You can navigate through the pages in the report by either clicking on the pages listed below, or by using the keyword search tool below to find specific information within the annual report.-
 1
1 -
2
-
3
-
4
-
5
-
6
-
7
-
8
-
9
-
10
-
11
-
12
-
13
-
14
-
15
-
16
-
17
-
18
-
19
-
20
-
21
-
22
-
23
-
24
-
25
-
26
-
27
-
28
-
29
-
30
-
31
-
32
-
33
-
34
-
35
-
36
-
37
-
38
-
39
-
40
-
41
-
42
-
43
-
44
-
45
-
46
-
47
-
48
-
49
-
50
-
51
-
52
-
53
-
54
-
55
-
56
-
57
-
58
-
59
-
60
-
61
-
62
-
63
-
64
-
65
-
66
-
67
-
68
-
69
-
70
-
71
-
72
-
73
-
74
-
75
-
76
-
77
-
78
-
79
-
80
-
81
-
82
-
83
-
84
-
85
-
86
-
87
-
88
-
89
-
90
-
91
-
92
-
93
-
94
-
95
-
96
-
97
-
98
-
99
-
100
-
101
-
102
-
103
-
104
-
105
-
106
-
107
-
108
-
109
-
110
-
111
-
112
-
113
-
114
-
115
-
116
-
117
-
118
-
119
-
120
-
121
-
122
-
123
-
124
-
125
-
126
-
127
-
128
-
129
-
130
-
131
-
132
-
133
-
134
-
135
-
136
-
 137
137 -
 138
138 -
 139
139 -
 140
140 -
 141
141 -
 142
142 -
 143
143 -
 144
144 -
 145
145 -
 146
146 -
 147
147 -
 148
148 -
 149
149 -
 150
150 -
 151
151 -
 152
152 -
 153
153 -
 154
154 -
 155
155 -
 156
156 -
 157
157 -
158
-
159
-
160
-
161
-
162
-
163
-
164
-
165
-
166
-
167
-
168
-
169
-
170
-
171
-
172
 |
 |
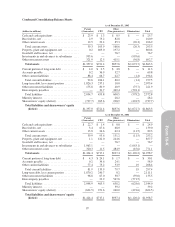
Condensed Consolidating Balance Sheets
As of December 31, 2005
(dollars in millions)
Parent
(Guarantor) CBT
Other
(Non-guarantors) Eliminations Total
Cash and cash equivalents .................. $ 23.9 $ 1.3 $ 0.5 $ — $ 25.7
Receivables, net .......................... 2.9 75.2 82.8 — 160.9
Other current assets ....................... 12.5 29.4 85.3 (20.3) 106.9
Total current assets ...................... 39.3 105.9 168.6 (20.3) 293.5
Property, plant and equipment, net ........... 0.2 603.0 197.2 — 800.4
Goodwill and licenses, net .................. — — 76.7 — 76.7
Investments in and advances to subsidiaries .... 995.6 — — (995.6) —
Other noncurrent assets .................... 321.9 12.5 415.1 (56.8) 692.7
Total assets ........................... $1,357.0 $721.4 $857.6 $(1,072.7) $1,863.3
Current portion of long-term debt ............ $ 4.0 $ 2.5 $ 4.8 $ — $ 11.3
Accounts payable ......................... 0.2 36.9 32.7 — 69.8
Other current liabilities .................... 88.4 66.7 42.7 (1.4) 196.4
Total current liabilities ................... 92.6 106.1 80.2 (1.4) 277.5
Long-term debt, less current portion .......... 1,826.3 237.1 10.0 — 2,073.4
Other noncurrent liabilities ................. 175.8 80.9 40.9 (75.7) 221.9
Intercompany payables .................... — 31.7 469.4 (501.1) —
Total liabilities ......................... 2,094.7 455.8 600.5 (578.2) 2,572.8
Minority interest .......................... — — 28.2 — 28.2
Shareowners’ equity (deficit) ................ (737.7) 265.6 228.9 (494.5) (737.7)
Total liabilities and shareowners’ equity
(deficit) ............................ $1,357.0 $721.4 $857.6 $(1,072.7) $1,863.3
As of December 31, 2004
Parent
(Guarantor) CBT
Other
(Non-guarantors) Eliminations Total
Cash and cash equivalents .................. $ 22.7 $ 1.4 $ 0.8 $ — $ 24.9
Receivables, net .......................... 3.4 67.6 68.0 — 139.0
Other current assets ....................... 13.8 24.6 62.4 (11.5) 89.3
Total current assets ...................... 39.9 93.6 131.2 (11.5) 253.2
Property, plant and equipment, net ........... 1.1 612.0 244.6 — 857.7
Goodwill and licenses, net .................. — — 76.7 — 76.7
Investments in and advances to subsidiaries .... 1,063.1 — — (1,063.1) —
Other noncurrent assets .................... 320.3 11.5 484.9 (45.6) 771.1
Total assets ........................... $1,424.4 $717.1 $937.4 $(1,120.2) $1,958.7
Current portion of long-term debt ............ $ 4.3 $ 24.1 $ 1.7 $ — $ 30.1
Accounts payable ......................... 0.2 34.6 24.1 — 58.9
Other current liabilities .................... 77.4 75.2 53.9 1.9 208.4
Total current liabilities ................... 81.9 133.9 79.7 1.9 297.4
Long-term debt, less current portion .......... 1,870.2 240.7 0.2 — 2,111.1
Other noncurrent liabilities ................. 96.8 67.0 30.7 (59.0) 135.5
Intercompany payables .................... — 23.9 547.6 (571.5) —
Total liabilities ......................... 2,048.9 465.5 658.2 (628.6) 2,544.0
Minority interest .......................... — — 39.2 — 39.2
Shareowners’ equity (deficit) ................ (624.5) 251.6 240.0 (491.6) (624.5)
Total liabilities and shareowners’ equity
(deficit) ............................ $1,424.4 $717.1 $937.4 $(1,120.2) $1,958.7
97