Cincinnati Bell 2005 Annual Report Download - page 131
Download and view the complete annual report
Please find page 131 of the 2005 Cincinnati Bell annual report below. You can navigate through the pages in the report by either clicking on the pages listed below, or by using the keyword search tool below to find specific information within the annual report.-
 1
1 -
2
-
3
-
4
-
5
-
6
-
7
-
8
-
9
-
10
-
11
-
12
-
13
-
14
-
15
-
16
-
17
-
18
-
19
-
20
-
21
-
22
-
23
-
24
-
25
-
26
-
27
-
28
-
29
-
30
-
31
-
32
-
33
-
34
-
35
-
36
-
37
-
38
-
39
-
40
-
41
-
42
-
43
-
44
-
45
-
46
-
47
-
48
-
49
-
50
-
51
-
52
-
53
-
54
-
55
-
56
-
57
-
58
-
59
-
60
-
61
-
62
-
63
-
64
-
65
-
66
-
67
-
68
-
69
-
70
-
71
-
72
-
73
-
74
-
75
-
76
-
77
-
78
-
79
-
80
-
81
-
82
-
83
-
84
-
85
-
86
-
87
-
88
-
89
-
90
-
91
-
92
-
93
-
94
-
95
-
96
-
97
-
98
-
99
-
100
-
101
-
102
-
103
-
104
-
105
-
106
-
107
-
108
-
109
-
110
-
111
-
112
-
113
-
114
-
115
-
116
-
117
-
118
-
119
-
120
-
 121
121 -
 122
122 -
 123
123 -
 124
124 -
 125
125 -
 126
126 -
 127
127 -
 128
128 -
 129
129 -
 130
130 -
 131
131 -
 132
132 -
 133
133 -
 134
134 -
 135
135 -
 136
136 -
 137
137 -
 138
138 -
 139
139 -
 140
140 -
 141
141 -
142
-
143
-
144
-
145
-
146
-
147
-
148
-
149
-
150
-
151
-
152
-
153
-
154
-
155
-
156
-
157
-
158
-
159
-
160
-
161
-
162
-
163
-
164
-
165
-
166
-
167
-
168
-
169
-
170
-
171
-
172
 |
 |

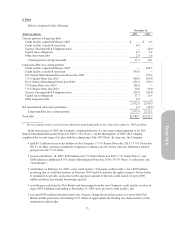
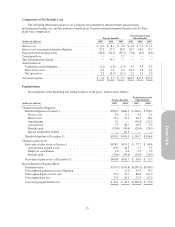
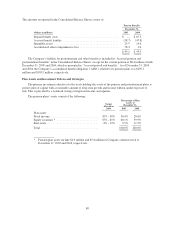
The postretirement and other plans’ assets consist of the following:
Health Care Group Life Insurance
Target
Allocation
2006
Percentage of Plan
Assets at
December 31, Target
Allocation 2006
Percentage of Plan
Assets at
December 31,
2005 2004 2005 2004
Plan assets:
Fixed income ....................... 35%-45% 40.9% 42.8% 35% - 45% 42.3% 20.3%
Equity securities ..................... 55%-65% 59.1% 57.2% 55% - 65% 57.7% 32.0%
Cash* ............................. — — — — — 47.7%
Total .............................. 100.0% 100.0% 100.0% 100.0%
* The plan assets included $13.2 million in cash to be used for group health benefits under postretirement plans at
December 31, 2004.
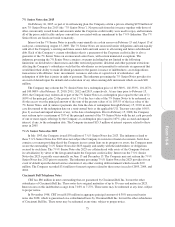
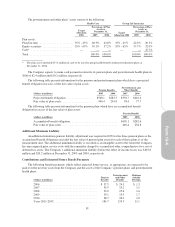
The Company expects to make cash payments related to its pension plans and postretirement health plans in
2006 of $2.4 million and $10.2 million, respectively.
The following table presents information for the pension and postretirement plans which have a projected
benefit obligation in excess of the fair value of plan assets:
Pension Benefits
Postretirement and
Other Benefits
(dollars in millions) 2005 2004 2005 2004
Projected benefit obligation .................. $500.1 $283.5 $356.7 $416.4
Fair value of plan assets ..................... 440.4 234.8 58.4 77.7
The following table presents information for the pension plans which have an accumulated benefit
obligation in excess of the fair value of plan assets:
Pension Benefits
(dollars in millions) 2005 2004
Accumulated benefit obligation ................................ $499.1 $282.6
Fair value of plan assets ...................................... 440.4 234.8
Additional Minimum Liability
An additional minimum pension liability adjustment was required in 2005 for the three pension plans as the
accumulated benefit obligation exceeded the fair value of pension plan assets for each of those plans as of the
measurement date. The additional minimum liability is recorded as an intangible asset to the extent the Company
has unrecognized prior service costs with the remainder charged to accumulated other comprehensive loss, net of
deferred tax assets. The Company’s additional minimum liability (before the effect of income taxes) was $103.8
million and $24.2 million at December 31, 2005 and 2004, respectively.
Contributions and Estimated Future Benefit Payments
The following benefit payments, which reflect expected future service, as appropriate, are expected to be
paid over the next ten years from the Company and the assets of the Company’s pension plans and postretirement
health plans:
(dollars in millions)
Pension
Benefits
Postretirement
and Other
Benefits
Medicare
Subsidy
Receipts
2006 ........................................ $ 57.5 $ 24.5 $ 1.3
2007 ........................................ 39.5 25.2 1.5
2008 ........................................ 39.0 25.6 1.6
2009 ........................................ 39.1 25.9 1.7
2010 ........................................ 38.7 26.2 1.8
Years 2011-2015 .............................. 184.7 124.3 11.1
81