Cincinnati Bell 2005 Annual Report Download - page 154
Download and view the complete annual report
Please find page 154 of the 2005 Cincinnati Bell annual report below. You can navigate through the pages in the report by either clicking on the pages listed below, or by using the keyword search tool below to find specific information within the annual report.-
 1
1 -
2
-
3
-
4
-
5
-
6
-
7
-
8
-
9
-
10
-
11
-
12
-
13
-
14
-
15
-
16
-
17
-
18
-
19
-
20
-
21
-
22
-
23
-
24
-
25
-
26
-
27
-
28
-
29
-
30
-
31
-
32
-
33
-
34
-
35
-
36
-
37
-
38
-
39
-
40
-
41
-
42
-
43
-
44
-
45
-
46
-
47
-
48
-
49
-
50
-
51
-
52
-
53
-
54
-
55
-
56
-
57
-
58
-
59
-
60
-
61
-
62
-
63
-
64
-
65
-
66
-
67
-
68
-
69
-
70
-
71
-
72
-
73
-
74
-
75
-
76
-
77
-
78
-
79
-
80
-
81
-
82
-
83
-
84
-
85
-
86
-
87
-
88
-
89
-
90
-
91
-
92
-
93
-
94
-
95
-
96
-
97
-
98
-
99
-
100
-
101
-
102
-
103
-
104
-
105
-
106
-
107
-
108
-
109
-
110
-
111
-
112
-
113
-
114
-
115
-
116
-
117
-
118
-
119
-
120
-
121
-
122
-
123
-
124
-
125
-
126
-
127
-
128
-
129
-
130
-
131
-
132
-
133
-
134
-
135
-
136
-
137
-
138
-
139
-
140
-
141
-
142
-
143
-
 144
144 -
 145
145 -
 146
146 -
 147
147 -
 148
148 -
 149
149 -
 150
150 -
 151
151 -
 152
152 -
 153
153 -
 154
154 -
 155
155 -
 156
156 -
 157
157 -
 158
158 -
 159
159 -
 160
160 -
 161
161 -
 162
162 -
 163
163 -
 164
164 -
165
-
166
-
167
-
168
-
169
-
170
-
171
-
172
 |
 |

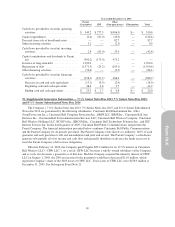
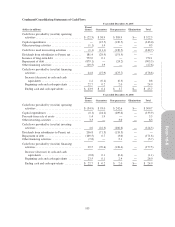
Year ended December 31, 2003
Parent
(Issuer) Guarantors Non-guarantors Eliminations Total
Cash flows provided by (used in) operating
activities ............................. $ 340.2 $(406.8) $ 377.2 $— $ 310.6
Capital expenditures ..................... (0.4) (8.8) (117.2) — (126.4)
Proceeds from sale of broadband assets ...... — 82.7 — — 82.7
Other investing activities .................. 3.2 (2.3) — — 0.9
Cash flows provided by (used in) investing
activities ............................. 2.8 71.6 (117.2) — (42.8)
Capital contributions and dividends to Parent,
net ................................. (300.2) 536.8 (236.6) — —
Issuance of long-term debt ................ 1,390.0 — — — 1,390.0
Repayment of debt ....................... (1,371.3) (195.1) (24.2) — (1,590.6)
Other financing activities ................. (76.6) (9.5) — — (86.1)
Cash flows provided by (used in) financing
activities ............................. (358.1) 332.2 (260.8) — (286.7)
Decrease in cash and cash equivalents ..... (15.1) (3.0) (0.8) — (18.9)
Beginning cash and cash equivalents ...... 38.6 3.1 3.2 — 44.9
Ending cash and cash equivalents ......... $ 23.5 $ 0.1 $ 2.4 $— $ 26.0
104