Cincinnati Bell 2005 Annual Report Download - page 72
Download and view the complete annual report
Please find page 72 of the 2005 Cincinnati Bell annual report below. You can navigate through the pages in the report by either clicking on the pages listed below, or by using the keyword search tool below to find specific information within the annual report.-
 1
1 -
2
-
3
-
4
-
5
-
6
-
7
-
8
-
9
-
10
-
11
-
12
-
13
-
14
-
15
-
16
-
17
-
18
-
19
-
20
-
21
-
22
-
23
-
24
-
25
-
26
-
27
-
28
-
29
-
30
-
31
-
32
-
33
-
34
-
35
-
36
-
37
-
38
-
39
-
40
-
41
-
42
-
43
-
44
-
45
-
46
-
47
-
48
-
49
-
50
-
51
-
52
-
53
-
54
-
55
-
56
-
57
-
58
-
59
-
60
-
61
-
 62
62 -
 63
63 -
 64
64 -
 65
65 -
 66
66 -
 67
67 -
 68
68 -
 69
69 -
 70
70 -
 71
71 -
 72
72 -
 73
73 -
 74
74 -
 75
75 -
 76
76 -
 77
77 -
 78
78 -
 79
79 -
 80
80 -
 81
81 -
 82
82 -
83
-
84
-
85
-
86
-
87
-
88
-
89
-
90
-
91
-
92
-
93
-
94
-
95
-
96
-
97
-
98
-
99
-
100
-
101
-
102
-
103
-
104
-
105
-
106
-
107
-
108
-
109
-
110
-
111
-
112
-
113
-
114
-
115
-
116
-
117
-
118
-
119
-
120
-
121
-
122
-
123
-
124
-
125
-
126
-
127
-
128
-
129
-
130
-
131
-
132
-
133
-
134
-
135
-
136
-
137
-
138
-
139
-
140
-
141
-
142
-
143
-
144
-
145
-
146
-
147
-
148
-
149
-
150
-
151
-
152
-
153
-
154
-
155
-
156
-
157
-
158
-
159
-
160
-
161
-
162
-
163
-
164
-
165
-
166
-
167
-
168
-
169
-
170
-
171
-
172
 |
 |

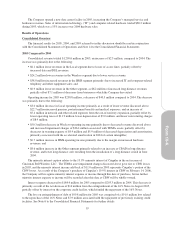
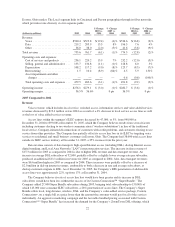
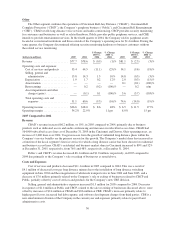
Dayton, Ohio market. The Local segment links its Cincinnati and Dayton geographies through its fiber networks,
which provides route diversity via two separate paths.
(dollars in millions) 2005 2004
$ Change
2005 vs.
2004
% Change
2005 vs.
2004 2003
$ Change
2004 vs.
2003
% Change
2004 vs.
2003
Revenue:
Voice .......................... $500.4 $519.8 $(19.4) (4)% $536.6 $(16.8) (3)%
Data ........................... 219.2 203.9 15.3 8% 196.3 7.6 4%
Other .......................... 36.0 38.0 (2.0) (5)% 41.6 (3.6) (9)%
Total revenue ...................... 755.6 761.7 (6.1) (1)% 774.5 (12.8) (2)%
Operating costs and expenses:
Cost of services and products ....... 236.1 220.2 15.9 7% 232.2 (12.0) (5)%
Selling, general and administrative . . . 133.7 134.8 (1.1) (1)% 128.8 6.0 5%
Depreciation .................... 108.2 117.2 (9.0) (8)% 125.7 (8.5) (7)%
Restructuring .................... 1.5 10.4 (8.9) (86)% 4.5 5.9 131%
Asset impairments and other
charges ....................... — — — — 0.6 (0.6) (100)%
Total operating costs and expenses . . . 479.5 482.6 (3.1) (1)% 491.8 (9.2) (2)%
Operating income .................. $276.1 $279.1 $ (3.0) (1)% $282.7 $ (3.6) (1)%
Operating margin ................... 36.5% 36.6% 0 pts 36.5% 0 pts
2005 Compared to 2004
Revenue
Voice revenue, which includes local service, switched access, information services and value added services
revenues decreased by $19.4 million versus 2004 as a result of a 4% decrease in local service access lines as well
as the loss of value added services revenue.
Access lines within the segment’s ILEC territory decreased by 47,000, or 5%, from 940,000 at
December 31, 2004 to 893,000 at December 31, 2005, which the Company believes results from several factors
including customers electing to use wireless communication (“wireless substitution”) in lieu of the traditional
local service, Company-initiated disconnections of customers with credit problems, and customers electing to use
service from other providers. The Company has partially offset its access line loss in its ILEC by targeting voice
services to residential and small business customers in Dayton, Ohio. The Company had 38,000 total access lines
outside its ILEC service territory at December 31, 2005, a 25% increase from the prior year.
Data revenue consists of data transport, high-speed Internet access (including DSL), dial-up Internet access,
digital trunking, and Local Area Network (“LAN”) interconnection services. The increase in data revenue of
$15.3 million for 2005 as compared to 2004 is due to higher DSL revenue and data transport revenue. An
increase in average DSL subscribers of 32,000, partially offset by a slightly lower average rate per subscriber,
produced an additional $11.1 million in revenue for 2005 as compared to 2004. Also, data transport revenues
were $6.6 million higher in 2005 as compared to 2004. These increases were partially offset by a decrease of
$2.0 million in dial-up internet revenues, attributable to both a decrease in rate and average subscribers, as
dial-up customers migrate to DSL. As of December 31, 2005, the Company’s DSL penetration of addressable
access lines was approximately 22%, up from 17% at December 31, 2004.
The Company believes its rate of access line loss would have been greater and its increase in DSL
subscribers would have been less without the success of its Custom ConnectionsSM “Super Bundle.” The
Company added 27,000 Super Bundle subscribers during 2005, bringing total subscribership to 150,000, of
which 143,000 were consumer ILEC subscribers, a 26% penetration of access lines. The Company’s Super
Bundle offers local, long distance, wireless, DSL, and the Company’s value-added service package, Custom
Connections®, on a single bill at a price lower than the amount the customer would pay for all of the services
individually. An aggressive marketing campaign and the favorable bundled pricing associated with Custom
ConnectionsSM “Super Bundle” has increased the demand for the Company’s ZoomTown DSL offering, which
22