Cincinnati Bell 2005 Annual Report Download - page 141
Download and view the complete annual report
Please find page 141 of the 2005 Cincinnati Bell annual report below. You can navigate through the pages in the report by either clicking on the pages listed below, or by using the keyword search tool below to find specific information within the annual report.-
 1
1 -
2
-
3
-
4
-
5
-
6
-
7
-
8
-
9
-
10
-
11
-
12
-
13
-
14
-
15
-
16
-
17
-
18
-
19
-
20
-
21
-
22
-
23
-
24
-
25
-
26
-
27
-
28
-
29
-
30
-
31
-
32
-
33
-
34
-
35
-
36
-
37
-
38
-
39
-
40
-
41
-
42
-
43
-
44
-
45
-
46
-
47
-
48
-
49
-
50
-
51
-
52
-
53
-
54
-
55
-
56
-
57
-
58
-
59
-
60
-
61
-
62
-
63
-
64
-
65
-
66
-
67
-
68
-
69
-
70
-
71
-
72
-
73
-
74
-
75
-
76
-
77
-
78
-
79
-
80
-
81
-
82
-
83
-
84
-
85
-
86
-
87
-
88
-
89
-
90
-
91
-
92
-
93
-
94
-
95
-
96
-
97
-
98
-
99
-
100
-
101
-
102
-
103
-
104
-
105
-
106
-
107
-
108
-
109
-
110
-
111
-
112
-
113
-
114
-
115
-
116
-
117
-
118
-
119
-
120
-
121
-
122
-
123
-
124
-
125
-
126
-
127
-
128
-
129
-
130
-
 131
131 -
 132
132 -
 133
133 -
 134
134 -
 135
135 -
 136
136 -
 137
137 -
 138
138 -
 139
139 -
 140
140 -
 141
141 -
 142
142 -
 143
143 -
 144
144 -
 145
145 -
 146
146 -
 147
147 -
 148
148 -
 149
149 -
 150
150 -
 151
151 -
152
-
153
-
154
-
155
-
156
-
157
-
158
-
159
-
160
-
161
-
162
-
163
-
164
-
165
-
166
-
167
-
168
-
169
-
170
-
171
-
172
 |
 |

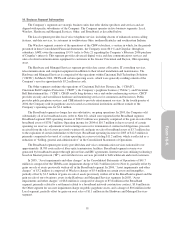
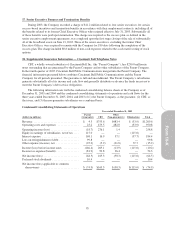
14. Business Segment Information
The Company’s segments are strategic business units that offer distinct products and services and are
aligned with specific subsidiaries of the Company. The Company operates in five business segments: Local,
Wireless, Hardware and Managed Services, Other, and Broadband, as described below.
The Local segment provides local voice telephone service, including dozens of enhanced custom calling
features, and data services, to customers in southwestern Ohio, northern Kentucky and southeastern Indiana.
The Wireless segment consists of the operations of the CBW subsidiary, a venture in which, for the periods
presented in these Consolidated Financial Statements, the Company owns 80.1% and Cingular, through its
subsidiary AWE, owns the remaining 19.9% (refer to Note 21 regarding the Company’s February 2006 purchase
of Cingular’s interest). This segment provides advanced, digital voice and data communications services and
sales of related communications equipment to customers in the Greater Cincinnati and Dayton, Ohio operating
areas.
The Hardware and Managed Services segment provides data center collocation, IT consulting services,
telecommunications and computer equipment in addition to their related installation and maintenance. The
Hardware and Managed Services is comprised of the operations within Cincinnati Bell Technology Solutions
(“CBTS”). In March 2004, CBTS sold certain operating assets, which were generally residing outside of the
Company’s area for approximately $3.2 million in cash.
The Other segment combines the operations of Cincinnati Bell Any Distance Inc. (“CBAD”),
Cincinnati Bell Complete Protection (“CBCP”), the Company’s payphone business (“Public”), and Cincinnati
Bell Entertainment Inc. (“CBE”). CBAD resells long distance voice and audio-conferencing services, CBCP
provides security and surveillance hardware and monitoring services for consumers and businesses, Public
provides public payphone services, and CBE intends to provide entertainment services. In the fourth quarter of
2004, the Company sold its payphone assets located at correctional institutions and those outside of the
Company’s operating area for $1.4 million.
The Broadband segment no longer has any substantive, on-going operations. In 2003, the Company sold
substantially all of its broadband assets (refer to Note 16), which were reported in the Broadband segment.
Broadband segment 2003 operating income of $344.5 million was primarily comprised of the gain on sale of the
broadband assets of $336.7 million. Operating income for 2004 of $10.7 million is due to reversal of certain
operating tax reserves, adjustment of restructuring reserves for termination of contractual obligations, proceeds
received from the sale of assets previously written off, and gain on sale of broadband assets of $3.7 million due
to the expiration of certain indemnities to the buyer. Broadband operating income for 2005 of $12.3 million is
primarily comprised of reversal of certain operating tax reserves totaling $11.2 million, which is reflected as a
reduction of “Selling, general and administrative” in the Consolidated Statements of Operations.
The Broadband segment previously provided data and voice communication services nationwide over
approximately 18,700 route miles of fiber-optic transmission facilities. Broadband segment revenue was
generated by broadband transport through private line and IRU agreements, Internet services utilizing technology
based on Internet protocol (“IP”), and switched voice services provided to both wholesale and retail customers.
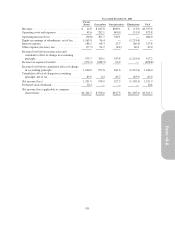
In 2005, “Asset impairments and other charges” in the Consolidated Statements of Operations of $41.7
million is composed of the TDMA asset impairment charge of $42.3 million (refer to Note 4), partially offset by
gains on sale of assets previously written off in the Broadband segment. In 2004, “Asset impairments and other
charges” of $3.2 million is composed of Wireless charges of $5.9 million on certain assets and intangibles,
partially offset by $1.5 million of gains on sale of assets previously written off in the Broadband segment and the
gain on sale of out-of-territory assets in the Hardware and Managed Services segment. In 2003, “Asset
impairments and other charges” of $8.8 million is composed of charges of $5.8 million in the Broadband
segment, primarily related to a settlement related to a broadband network construction contract, $3.6 million in
the Other segment for an asset impairment charge on public payphone assets, and a charge of $0.6 million in the
Local segment, partially offset by gains on asset sales of $1.1 million in the Hardware and Managed Services
segment.
91