Cincinnati Bell 2005 Annual Report Download - page 73
Download and view the complete annual report
Please find page 73 of the 2005 Cincinnati Bell annual report below. You can navigate through the pages in the report by either clicking on the pages listed below, or by using the keyword search tool below to find specific information within the annual report.-
 1
1 -
2
-
3
-
4
-
5
-
6
-
7
-
8
-
9
-
10
-
11
-
12
-
13
-
14
-
15
-
16
-
17
-
18
-
19
-
20
-
21
-
22
-
23
-
24
-
25
-
26
-
27
-
28
-
29
-
30
-
31
-
32
-
33
-
34
-
35
-
36
-
37
-
38
-
39
-
40
-
41
-
42
-
43
-
44
-
45
-
46
-
47
-
48
-
49
-
50
-
51
-
52
-
53
-
54
-
55
-
56
-
57
-
58
-
59
-
60
-
61
-
62
-
 63
63 -
 64
64 -
 65
65 -
 66
66 -
 67
67 -
 68
68 -
 69
69 -
 70
70 -
 71
71 -
 72
72 -
 73
73 -
 74
74 -
 75
75 -
 76
76 -
 77
77 -
 78
78 -
 79
79 -
 80
80 -
 81
81 -
 82
82 -
 83
83 -
84
-
85
-
86
-
87
-
88
-
89
-
90
-
91
-
92
-
93
-
94
-
95
-
96
-
97
-
98
-
99
-
100
-
101
-
102
-
103
-
104
-
105
-
106
-
107
-
108
-
109
-
110
-
111
-
112
-
113
-
114
-
115
-
116
-
117
-
118
-
119
-
120
-
121
-
122
-
123
-
124
-
125
-
126
-
127
-
128
-
129
-
130
-
131
-
132
-
133
-
134
-
135
-
136
-
137
-
138
-
139
-
140
-
141
-
142
-
143
-
144
-
145
-
146
-
147
-
148
-
149
-
150
-
151
-
152
-
153
-
154
-
155
-
156
-
157
-
158
-
159
-
160
-
161
-
162
-
163
-
164
-
165
-
166
-
167
-
168
-
169
-
170
-
171
-
172
 |
 |

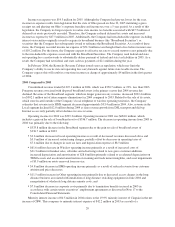
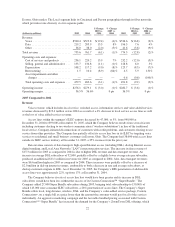
added 32,000 subscribers in 2005, growing 24% compared to December 31, 2004, to 163,000 subscribers. As a
result of this growth, total lines to the customer (defined as access lines plus DSL subscribers) as of
December 31, 2005 decreased only slightly compared to December 31, 2004, and revenue per household
increased 3% to $48.73.
Costs and Expenses
Cost of services and products increased by $15.9 million for 2005 versus 2004 primarily due to the
following:
•$15.5 million increase for higher pension and postretirement expense. See “Accounting for Pension and
Postretirement Expenses” in the “Critical Accounting Policies and Estimates” section;
•$2.7 million increase in employee health costs;
•$11.9 million decrease in state gross receipts tax and property taxes. Beginning with the third quarter of
2004 through the second quarter of 2005, CBT was not subject to Ohio franchise taxes based on gross
receipts, but instead was subject to state and local income tax. See “Accounting for Taxes” in the “Critical
Accounting Policies and Estimates” section for discussion of Ohio tax legislation passed in 2005 that will
impact the Company’s future state income tax expense and operating tax expense;
•$5.4 million increase in network and other costs related to the out-of-territory expansion of the Company’s
CLEC operations;
•$1.3 million increase in rights-to-use fees for webhosting services and product costs to support additional
DSL subscribers; and
•remaining cost increases are primarily associated with increases in fuel and energy costs, higher
regulatory fees, and software development.
Selling, general and administrative expenses decreased $1.1 million compared to 2004. Higher costs of
$4.5 million for pension, postretirement and employee medical expenses were more than offset by lower
advertising costs of $2.4 million, lower labor and other employee costs, and lower consulting fees.
Depreciation expense decreased $9.0 million in 2005 compared to 2004. The decreases were primarily due
to changes in depreciation rates in the fourth quarter of 2004 used as a result of updated estimates of the
depreciable assets’ useful lives.
In 2004, the Company initiated a restructuring to improve operating efficiencies and reduce operating
expenses resulting in a charge of $10.4 million. The Company incurred a $1.5 million charge in 2005 related to
the outsourcing of its directory assistance services. See Note 3 to the Consolidated Financial Statements for
further discussion.
2004 Compared to 2003
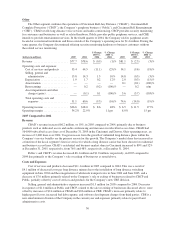
Local service revenue of $761.7 million during 2004 decreased 2%, or $12.8 million, compared to 2003.
Revenue declines related to access line losses were partially offset by DSL revenue growth.
Voice revenue of $519.8 million in 2004 decreased 3%, or $16.8 million, compared to 2003. Local service
revenue declined $11.9 million as a result of both fewer access lines in service, which declined 1.6% from
986,000 at December 31, 2003 to 970,000 at December 31, 2004, and a 1% lower average revenue per line. The
lower average revenue per line is the result of selected price discounts to enterprise customers and certain rate
plans related to the service launch in Dayton, Ohio.
Access lines within the segment’s ILEC territory decreased 37,000, or 4%, from 977,000 to 940,000. The
majority of this decrease is a 21,000 decrease in residential access lines, which the Company believes is
primarily due to customers electing to use wireless communication (“wireless substitution”) in lieu of the
traditional local service. In March 2004, the Company expanded its product suite in Dayton, Ohio and began to
mass market voice services to residential and small business customers. This helped to increase CLEC access
lines by 21,000 lines during 2004, bringing total access lines outside its ILEC service territory to 30,000, which
is 3% of its total access lines at December 31, 2004.
23