Cincinnati Bell 2005 Annual Report Download - page 77
Download and view the complete annual report
Please find page 77 of the 2005 Cincinnati Bell annual report below. You can navigate through the pages in the report by either clicking on the pages listed below, or by using the keyword search tool below to find specific information within the annual report.-
 1
1 -
2
-
3
-
4
-
5
-
6
-
7
-
8
-
9
-
10
-
11
-
12
-
13
-
14
-
15
-
16
-
17
-
18
-
19
-
20
-
21
-
22
-
23
-
24
-
25
-
26
-
27
-
28
-
29
-
30
-
31
-
32
-
33
-
34
-
35
-
36
-
37
-
38
-
39
-
40
-
41
-
42
-
43
-
44
-
45
-
46
-
47
-
48
-
49
-
50
-
51
-
52
-
53
-
54
-
55
-
56
-
57
-
58
-
59
-
60
-
61
-
62
-
63
-
64
-
65
-
66
-
 67
67 -
 68
68 -
 69
69 -
 70
70 -
 71
71 -
 72
72 -
 73
73 -
 74
74 -
 75
75 -
 76
76 -
 77
77 -
 78
78 -
 79
79 -
 80
80 -
 81
81 -
 82
82 -
 83
83 -
 84
84 -
 85
85 -
 86
86 -
 87
87 -
88
-
89
-
90
-
91
-
92
-
93
-
94
-
95
-
96
-
97
-
98
-
99
-
100
-
101
-
102
-
103
-
104
-
105
-
106
-
107
-
108
-
109
-
110
-
111
-
112
-
113
-
114
-
115
-
116
-
117
-
118
-
119
-
120
-
121
-
122
-
123
-
124
-
125
-
126
-
127
-
128
-
129
-
130
-
131
-
132
-
133
-
134
-
135
-
136
-
137
-
138
-
139
-
140
-
141
-
142
-
143
-
144
-
145
-
146
-
147
-
148
-
149
-
150
-
151
-
152
-
153
-
154
-
155
-
156
-
157
-
158
-
159
-
160
-
161
-
162
-
163
-
164
-
165
-
166
-
167
-
168
-
169
-
170
-
171
-
172
 |
 |

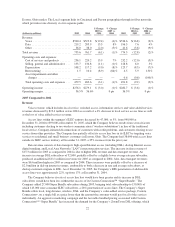
2004 Compared to 2003
Revenue
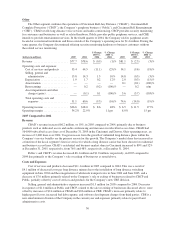
Wireless segment revenue increased $2.2 million, or 1%, to $261.7 million during 2004 compared to 2003.
Equipment revenue increased $6.6 million in 2004 primarily due to a 27% increase in new service activations
and 17% of CBW’s existing TDMA customers purchasing new handsets to switch their service to the Company’s
new GSM service. This increase in equipment revenue offset a $3.6 million decrease in roaming revenue and a
$0.8 million decrease in CBW subscriber service revenue.
CBW’s roaming revenue declined primarily as a result of a 20% decrease in average revenue per roaming
minute as a greater amount of AWE roaming traffic used lower priced GSM minutes than in 2003. Total roaming
revenue equaled $13.0 million in 2004.
Subscriber service revenue declined $0.8 million as a result of a $3.8 million postpaid service revenue
decrease more than offsetting a $3.0 million increase in prepaid service revenue. Postpaid revenue decreased as a
result of a 5,600 decrease in subscribers, driven primarily by an average monthly customer churn which
increased to 2.6% in 2004 compared to 1.8% in 2003, and a $0.50 decrease in postpaid ARPU, excluding
roaming revenue, from $51.42 in 2003 to $50.92, which is in part the result of customer migrations to lower
priced GSM rate plans. The Company believes that the increase in postpaid churn during the year is the result of
a combination of factors, most notably network quality issues created by CBW’s network migration. At
December 31, 2004 CBW had 306,300 postpaid subscribers.
Prepaid service revenue increases were largely the result of increased subscribers. As of December 31,
2004, prepaid subscribers totaled approximately 174,700, a 12,200 increase over December 31, 2003. Likely a
result of both the aforementioned network quality issues as well as unmeasured TDMA customer migrations to
the new GSM network, average monthly prepaid customer churn increased to 6.1% in 2004 compared to 4.9% in
2003. Total wireless subscribers at December 31, 2004 were approximately 481,000, or approximately 14% of
the population in CBW’s licensed operating territory.
Data revenue of $14.7 million increased $5.6 million, or 62%, from $9.1 million as compared to 2003. Data
revenue is 6% of total revenue.
As mandated by the FCC, wireless local number portability (“WLNP”) was effective November 24, 2003
and allows customers the ability to change service providers within the same local area and retain the same phone
number. WLNP did not have any significant impact in 2004.
Costs and Expenses
Cost of services and products increased $22.7 million, or 21%, to $133.2 million in 2004 compared to the
prior year. The increase was due largely to an $18.0 million increase of costs associated with increased handset
subsidies, which supported both a 27% increase in new gross customer additions as well as the migration of 17%
of the Company’s legacy TDMA customers to its new GSM network.
In the fourth quarter of 2004, CBW recorded a $3.2 million adjustment related to prior periods to account
for certain rent escalations associated with its tower site leases on a straight-line basis. These rent escalations are
associated with lease renewal options that were deemed to be reasonably assured of renewal, thereby extending
the initial term of the leases. The adjustment was not considered material to the current year or to any prior years’
earnings, earnings trends, or individual financial statement line items. Additionally, customer service expense
increased $2.4 million as a result of increased customer contacts, driven by the GSM migration and quality
issues, which was offset by a decrease in incollect expense of $4.7 million. Lower incollect expense was the
result of a 20% decrease in the average cost per roaming minute of which a greater percentage was on the lower
priced GSM network.
Selling, general, and administrative expenses of $56.5 million increased by $6.5 million, or 13%, in 2004,
primarily as a result of a $3.3 million increase in advertising and promotional expense to support the 27%
increase in new customer gross additions.
27