Chrysler 1999 Annual Report Download - page 38
Download and view the complete annual report
Please find page 38 of the 1999 Chrysler annual report below. You can navigate through the pages in the report by either clicking on the pages listed below, or by using the keyword search tool below to find specific information within the annual report.-
 1
1 -
2
-
3
-
4
-
5
-
6
-
7
-
8
-
9
-
10
-
11
-
12
-
13
-
14
-
15
-
16
-
17
-
18
-
19
-
20
-
21
-
22
-
23
-
24
-
25
-
26
-
27
-
 28
28 -
 29
29 -
 30
30 -
 31
31 -
 32
32 -
 33
33 -
 34
34 -
 35
35 -
 36
36 -
 37
37 -
 38
38 -
 39
39 -
 40
40 -
 41
41 -
 42
42 -
 43
43 -
 44
44 -
 45
45 -
 46
46 -
 47
47 -
 48
48 -
49
-
50
-
51
-
52
-
53
-
54
-
55
-
56
-
57
-
58
-
59
-
60
-
61
-
62
-
63
 |
 |
37
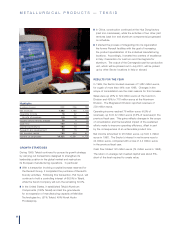
Report on Operations – Automobiles
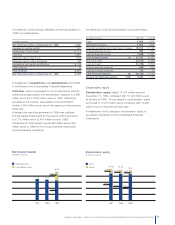
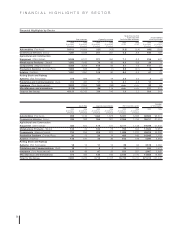
Highlights
(in millions of euros) 1999 1998 1997
Net revenues 24,101 24,859 26,202
Operating income (loss) (121) (108) 758
As a % of revenues (0.5) (0.4) 2.9
Income (loss) before
minority interest (493) (258) 402
Cash flow 855 1,146 2,068
Capital expenditures 1,464 1,373 1,341
Research and development 711 608 535
Net invested capital 5,021 5,863 5,992
Number of employees 82,553 93,514 118,109
Excluding the contribution of affiliates, Fiat Auto sold 2,328,000
vehicles worldwide, compared with 2,397,000 units in 1998.
Lower sales in South America are the main reason for this
2.9% decline.
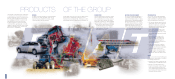
PRODUCT INNOVATION
Fiat Auto continued to renew and improve its range of
products and services with the goal of strengthening the
competitiveness of its brands.
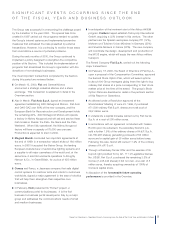
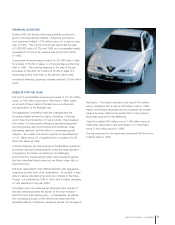
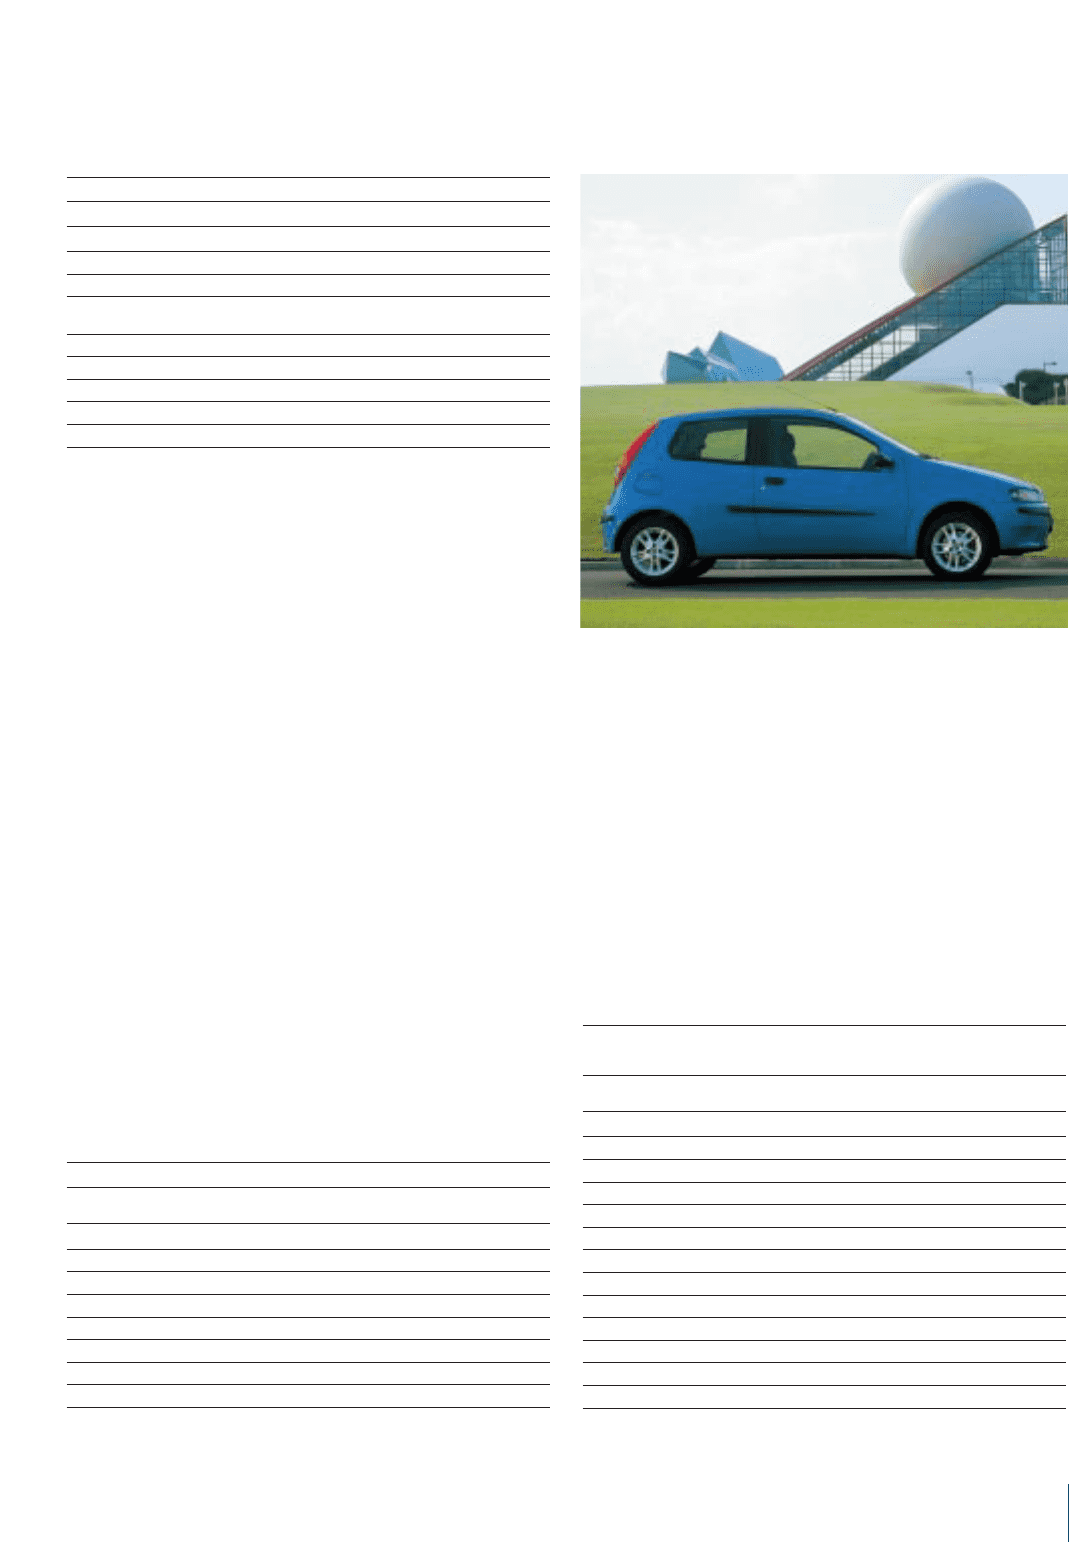
The most significant event of the year was the launch of
the new Fiat Punto, a car that combines ride comfort with
excellent road handling and fuel economy. It replaced a
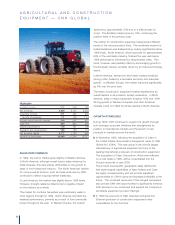
AUTOMOBILES — FIAT AUTO
SALES PERFORMANCE
In 1999, the automobile market grew a further 5% in Europe,
posting the seventh consecutive up year, and continued to
expand in North America. However, demand contracted in
the Mercosur countries, with an annual decline of about 18%
in Brazil and Argentina.
With 2,349,000 automobiles sold, the Italian market
contracted slightly (-1.3%) compared with 1998. This
represents a relatively healthy performance, considering
that sales during the first half of 1998 had been buoyed
by government incentives for the replacement of old cars.
Demand held steady in Germany, but increased in France
(+10.5%) and Spain (+18%). Shipments were also up in
Greece (+46%), Holland (+12.7%), Belgium (+8%) and Ireland
(+19.2%). The Polish market grew by a healthy 21.3%,
accounting for more than 600,000 cars.
Continuing the positive trend of recent years, demand for light
commercial vehicles expanded by 7.3% for Western Europe
as a whole and by an even stronger 9% in Italy.
The aggressive price competition that has increasingly
characterized the markets in recent years continued in 1999,
particularly in Italy where market share declined by 3.4
percentage points. However, the first signs of a reversal in
this trend became apparent in January of the current year.
Automobile Market
99/98
(in thousands of units) 1999 1998 ∆in %
France 2,103 1,903 10.5
Germany 3,678 3,631 1.3
Great Britain 2,203 2,255 (2.3)
Italy 2,349 2,379 (1.3)
Spain 1,403 1,189 18.0
Western Europe 14,865 14,185 4.8
Poland 615 507 21.3
Brazil 1,017 1,236 (17.7)
Sales Performance – Automobiles and Light Commercial
Vehicles
99/98
(in thousands of units) 1999 1998 ∆in %
France 151 152 (0.7)
Germany 185 195 (5.1)
Great Britain 96 109 (11.9)
Italy 955 951 0.4
Spain 73 67 9.0
Rest of Western Europe 216 210 2.9
Total Western Europe 1,676 1,684 (0.5)
Poland 177 160 10.6
Brazil 304 365 (16.7)
Rest of the world 171 188 (9.0)
Total units sold 2,328 2,397 (2.9)
Affiliated companies 59 89 (33.7)
Grand total 2,387 2,486 (4.0)