Chrysler 1999 Annual Report Download - page 30
Download and view the complete annual report
Please find page 30 of the 1999 Chrysler annual report below. You can navigate through the pages in the report by either clicking on the pages listed below, or by using the keyword search tool below to find specific information within the annual report.-
 1
1 -
2
-
3
-
4
-
5
-
6
-
7
-
8
-
9
-
10
-
11
-
12
-
13
-
14
-
15
-
16
-
17
-
18
-
19
-
 20
20 -
 21
21 -
 22
22 -
 23
23 -
 24
24 -
 25
25 -
 26
26 -
 27
27 -
 28
28 -
 29
29 -
 30
30 -
 31
31 -
 32
32 -
 33
33 -
 34
34 -
 35
35 -
 36
36 -
 37
37 -
 38
38 -
 39
39 -
 40
40 -
41
-
42
-
43
-
44
-
45
-
46
-
47
-
48
-
49
-
50
-
51
-
52
-
53
-
54
-
55
-
56
-
57
-
58
-
59
-
60
-
61
-
62
-
63
 |
 |
29
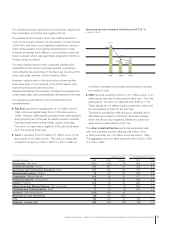
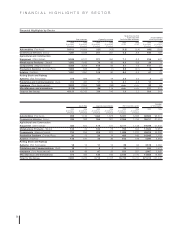
Report on Operations – Analysis of the Financial Position and Operating Results of the Fiat Group and Fiat S.p.A.
A breakdown of the changes affecting net financial position in
1999 is provided below:
(in millions of euros)
Net financial position at December 31, 1998 1,420
Decrease in working capital 972
Investments in fixed assets (2,712)
Cash flow 2,860
Dividends paid by Fiat S.p.A. (350)
Dividends paid by other companies (67)
Acquisitions and capital contributions (6,149)
Other changes (5)
Total changes (5,451)
Net financial position at December 31, 1999 (4,031)
A breakdown of acquisitions and capitalizations is provided
in the Notes to the Consolidated Financial Statements.
Cash flow, which is equivalent to net income before minority
interest plus depreciation and amortization, declined to 2,860
million euros from 3,226 million euros in 1998, reflecting a
decrease in net income. Depreciation and amortization
totaled 2,354 million euros, about the same as in the previous
fiscal year.
However, the cash flow generated in 1999 was sufficient
to fund capital investments for the period, which amounted
to 2,712 million euros (2,418 million euros in 1998).
Investments in fixed assets include 465 million euros (353
million euros in 1998) for the Group long-term automobile
and truck leasing operations.
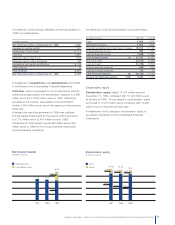
A breakdown of net financial position is provided below:
(in millions of euros) 12/31/99 12/31/98
Cash 1,906 1,673
Marketable securities 1,613 1,903
Financial receivables and investments in leases 19,103 17,128
Accrued financial income 295 212
Deferred financial income (1,892) (1,957)
Total financial assets (A)21,025 18,959
Short-term debt (14,073) (9,588)
Long-term debt (10,756) (7,801)
Accrued financial expenses (309) (200)
Deferred financial expenses 82 50
Total financial liabilities (B) (25,056) (17,539)
Group’s net financial position (A-B) (4,031) 1,420
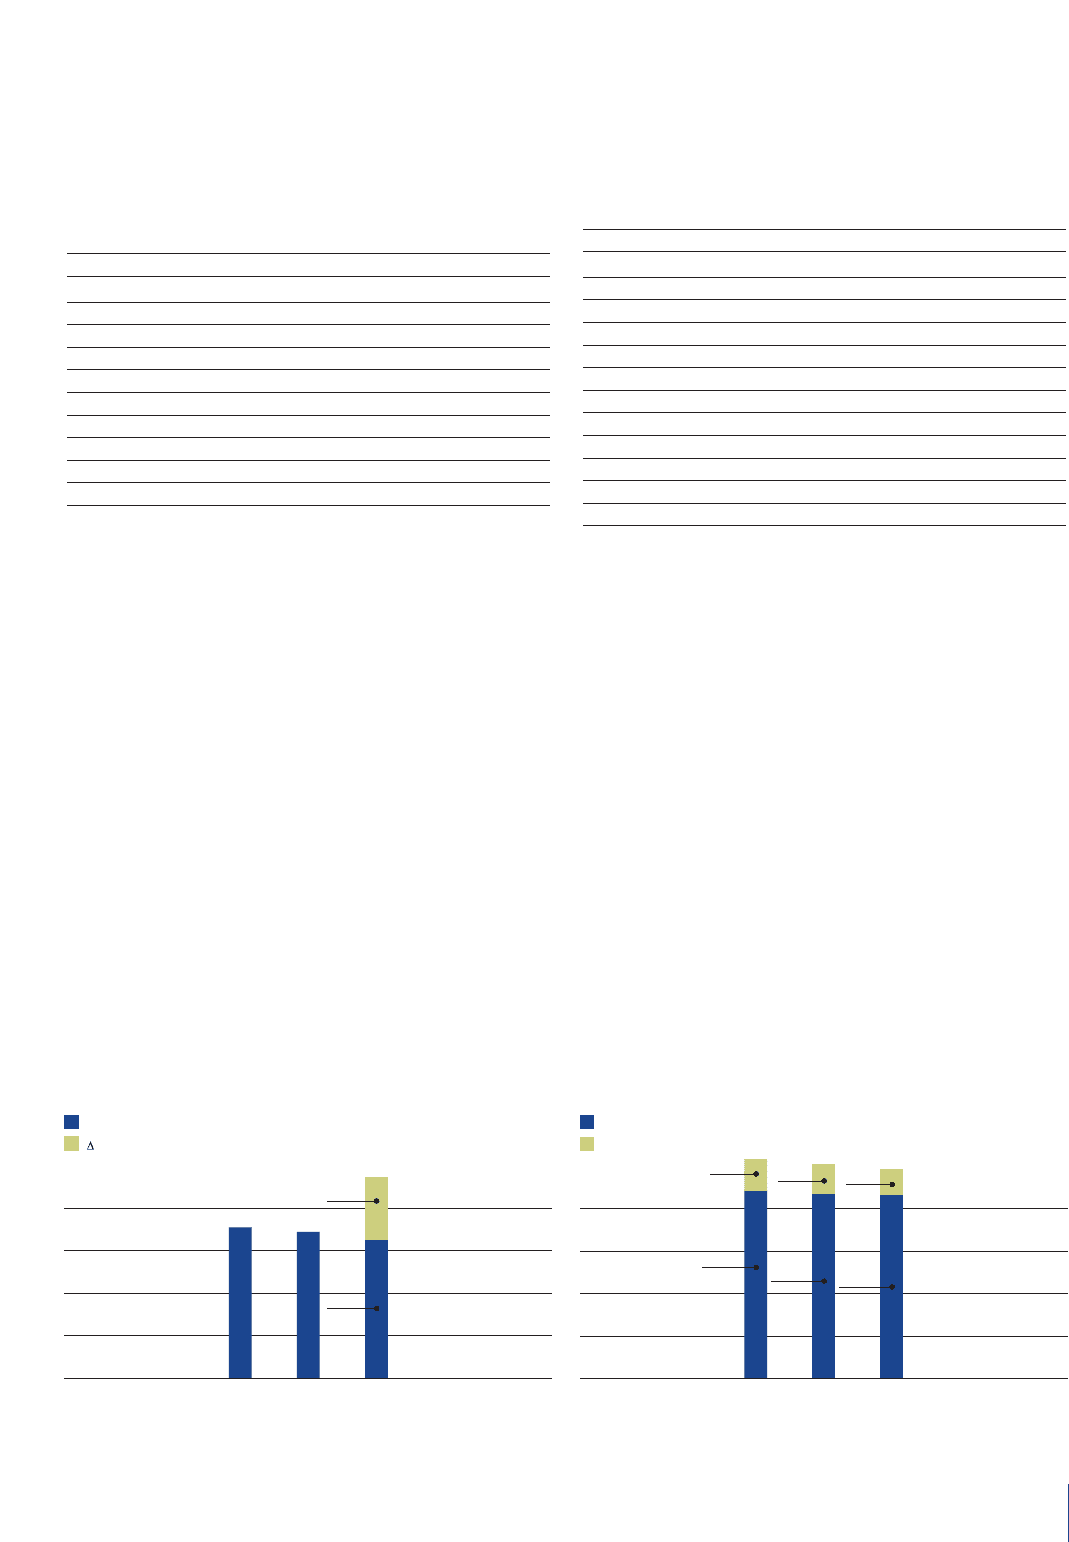
Stockholders’ equity
Stockholders’ equity totaled 14,767 million euros at
December 31, 1999, compared with 15,120 million euros
at the end of 1998. Group interest in stockholders’ equity
amounted to 12,874 million euros compared with 12,998
million euros in the previous fiscal year.
A breakdown of the changes in stockholders’ equity is
provided in the Notes to the Consolidated Financial
Statements.
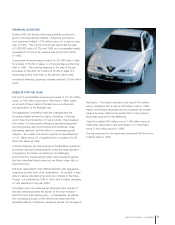
Net Invested Capital
(in millions of euros)
Comparable basis
consolidation scope
1999
18,798
19981997
13,700
14,122
5,898
12,900
Stockholders’ equity
(in millions of euros)
Group
Minority
1999
14,767
19981997
15,120
15,462
13,203
2,259
12,998
2,122 1,893
12,874