Chrysler 1999 Annual Report Download - page 29
Download and view the complete annual report
Please find page 29 of the 1999 Chrysler annual report below. You can navigate through the pages in the report by either clicking on the pages listed below, or by using the keyword search tool below to find specific information within the annual report.-
 1
1 -
2
-
3
-
4
-
5
-
6
-
7
-
8
-
9
-
10
-
11
-
12
-
13
-
14
-
15
-
16
-
17
-
18
-
 19
19 -
 20
20 -
 21
21 -
 22
22 -
 23
23 -
 24
24 -
 25
25 -
 26
26 -
 27
27 -
 28
28 -
 29
29 -
 30
30 -
 31
31 -
 32
32 -
 33
33 -
 34
34 -
 35
35 -
 36
36 -
 37
37 -
 38
38 -
 39
39 -
40
-
41
-
42
-
43
-
44
-
45
-
46
-
47
-
48
-
49
-
50
-
51
-
52
-
53
-
54
-
55
-
56
-
57
-
58
-
59
-
60
-
61
-
62
-
63
 |
 |

28
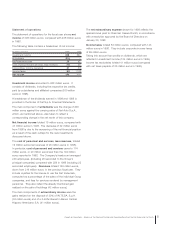
Net deferred tax assets
At December 31, 1999, net deferred tax assets amounted to
574 million euros, compared with 313 million euros in 1998.
The amount shown under this heading is the net effect of
deferred tax liabilities and prepaid taxes due primarily to from
the following temporary differences: accelerated depreciation,
capital gains reinvested under a deferred tax treatment,
inventories, taxed reserves for risks and charges and allowances
for doubtful accounts in excess of the percentage deductible
for tax purposes.
A more detailed analysis of this item is provided in the Notes
to the Consolidated Financial Statements.
Reserves and allowances
At December 31, 1999, reserves and allowances totaled
16,199 million euros. They included the technical reserves
of the insurance companies (10,293 million euros), the reserve
for severance indemnities of the Italian employees (2,138
million euros), the reserve for pensions and similar obligations
(821 million euros), the warranty and technical support reserve
(959 million euros) and other reserves (1,998 million euros).
The gain of 3,313 million euros over the 12,886 million euros
reported at the end of 1998 is due primarily to the higher
technical reserves of the insurance companies, which rose
by 3,325 million euros, reflecting a significant increase in
premium income and the changes in the consolidation scope
(989 million euros due to the consolidation of the Guardian
Group).
A more detailed analysis of this item is provided in the Notes
to the Consolidated Financial Statements.
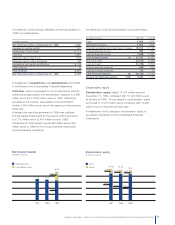
Net Invested Capital
At December 31, 1999, net invested capital totaled 18,798
million euros, or 5,098 million euros more than at the end
of 1998. The change in the scope of consolidation and the
acquisitions completed in 1999 (Case, Pico and Fraikin in
particular) account for most of the increase. Had the scope
of consolidation remained the same, net invested capital
would have resulted 800 million euros less than at December
31, 1998.
On a comparable basis, the asset turnover rate was 3.3,
almost unchanged from 1998.
Value Creation
The return on invested capital, which is the ratio of operating
income plus investment income to average net invested
capital, was about 7%, falling short of the 10% needed to
create stockholder value in 1999. As a result, value creation
was a negative 480 million euros, as compared with a
negative 714 million euros in 1998, which was calculated
using a rate of return of 12%.
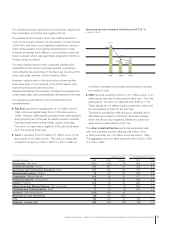
Net Financial Position of the Group
At December 31, 1999, the consolidated net financial position
of the Group showed net borrowings of 4,031 million euros,
compared with net liquidity of 1,420 million euros at the
beginning of the fiscal year.
The rise in the level of indebtedness reflects the increased
resources required to fund the acquisitions carried out by
the Group, which entailed outlays totaling over 6,000 million
euros.
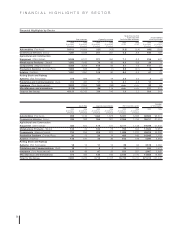
12.31.1999 12.31.1998
Industrial (*) Insurance Industrial (*) Insurance
(in millions of euros) Activities Activities Consolidated Activities Activities Consolidated
Net inventories 7,987 – 7,987 7,084 – 7,084
Trade receivables 6,095 570 6,665 5,999 479 6,478
Trade payables (10,828) (242) (11,070) (8,765) (163) (8,927)
Other receivables (payables), net (2,600) (84) (2,684) (2,706) (58) (2,765)
Working capital 654 244 898 1,612 258 1,870
Net property, plant and equipment 15,014 906 15,920 14,271 784 15,056
Other fixed assets 7,937 9,714 17,605 2,865 6,490 9,347
Net deferred tax assets 631 (57)574334(20)313
Reserves and allowances (5,814) (10,385) (16,199) (5,819) (7,067) (12,886)
Net invested capital 18,422 422 18,798 13,263 445 13,700
Net financial position (5,649)1,618 (4,031) 3 1,417 1,420
Stockholders’ equity before minority interest 12,773 2,040 14,767 13,266 1,862 15,120
Fiat’s interest in stockholders’ equity 11,310 1,610 12,874 12,029 981 12,998
(*) It includes the Toro Assicurazioni Group, Augusta Assicurazioni S.p.A. and Essex & General Insurance Ltd.