Chrysler 1999 Annual Report Download - page 37
Download and view the complete annual report
Please find page 37 of the 1999 Chrysler annual report below. You can navigate through the pages in the report by either clicking on the pages listed below, or by using the keyword search tool below to find specific information within the annual report.-
 1
1 -
2
-
3
-
4
-
5
-
6
-
7
-
8
-
9
-
10
-
11
-
12
-
13
-
14
-
15
-
16
-
17
-
18
-
19
-
20
-
21
-
22
-
23
-
24
-
25
-
26
-
 27
27 -
 28
28 -
 29
29 -
 30
30 -
 31
31 -
 32
32 -
 33
33 -
 34
34 -
 35
35 -
 36
36 -
 37
37 -
 38
38 -
 39
39 -
 40
40 -
 41
41 -
 42
42 -
 43
43 -
 44
44 -
 45
45 -
 46
46 -
 47
47 -
48
-
49
-
50
-
51
-
52
-
53
-
54
-
55
-
56
-
57
-
58
-
59
-
60
-
61
-
62
-
63
 |
 |

36
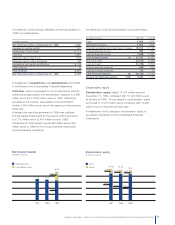
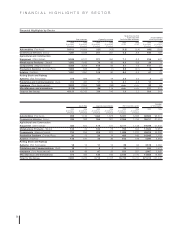
FINANCIAL HIGHLIGHTS BY SECTOR
Financial Highlights by Sector
Operating income
from Industrial Income before
Net revenues Operating income Activities/Net revenues minority interest
1999 1998 1999 1998 1999 1998 1999 1998
(in millions (in millions (in millions (in millions (in %) (in %) (in millions (in millions
of euros) of euros) of euros) of euros) of euros) of euros)
Automobiles (Fiat Auto) 24,101 24,859 (121) (108) (0.5) (0.4) (493) (258)
Commercial Vehicles (Iveco) 7,387 6,649 311 261 4.2 3.9 180 192
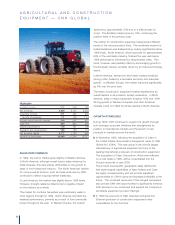
Agricultural and Construction
Equipment (CNH Global) 5,246 5,127 371 452 7.1 8.8 216 507
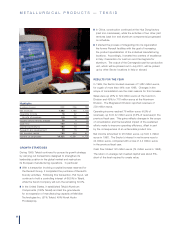
Metallurgical Products (Teksid) 1,682 1,165 76 42 4.5 3.6 26 4
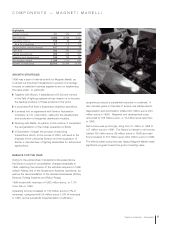
Components (Magneti Marelli) 4,062 3,793 108 56 2.7 1.5 107 21
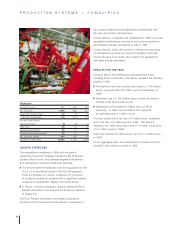
Production Systems (Comau/Pico) 1,693 843 43 (1) 2.5 (0.1) (8) (6)
Aviation (FiatAvio) 1,361 1,361 109 60 8.0 4.4 61 79
Rolling Stock and Railway
Systems (Fiat Ferroviaria) 375 389 13 18 3.5 4.6 3(1)
Publishing and Communications (Itedi) 413 437 17 19 4.1 4.3 11 –
Insurance (Toro Assicurazioni) 3,922 2,959 (103) (168) n.m. n.m. 92 64
Miscellaneous and eliminations (2,119) (1,813) (36) 115 n.m. n.m. 311 314
Total for the Group 48,123 45,769 788 746 1.9 2.2 506 916
Number
Cash flow Capital expenditures Net invested capital of employees
1999 1998 1999 1998 1999 1998 1999 1998
(in millions (in millions (in millions (in millions (in millions (in millions
of euros) of euros) of euros) of euros) of euros) of euros)
Automobiles (Fiat Auto) 855 1,146 1,464 1,373 5,021 5,863 82,553 93,514
Commercial Vehicles (Iveco) 433 368 359 307 2,359 1,764 36,217 31,912
Agricultural and Construction
Equipment (CNH Global) 333 624 178 151 5,777 1,123 19,049 21,344
Metallurgical Products (Teksid) 123 74 182 73 793 504 14,522 10,981
Components (Magneti Marelli) 310 254 209 222 1,289 1,270 25,613 29,398
Production Systems (Comau/Pico) 30 12 26 14 485 165 16,943 7,103
Aviation (FiatAvio) 145 167 42 36 163 159 5,590 5,962
Rolling Stock and Railway
Systems (Fiat Ferroviaria) 18 15 11 12 29 94 2,109 2,294
Publishing and Communications (Itedi) 19 11 8925 21 934 1,473
Insurance (Toro Assicurazioni) 120 89 97 25 311 327 2,907 2,869
Miscellaneous and eliminations 474 466 136 196 2,546 2,410 14,882 13,699
Total for the Group 2,860 3,226 2,712 2,418 18,798 13,700 221,319 220,549