Chrysler 1999 Annual Report Download - page 26
Download and view the complete annual report
Please find page 26 of the 1999 Chrysler annual report below. You can navigate through the pages in the report by either clicking on the pages listed below, or by using the keyword search tool below to find specific information within the annual report.-
 1
1 -
2
-
3
-
4
-
5
-
6
-
7
-
8
-
9
-
10
-
11
-
12
-
13
-
14
-
15
-
 16
16 -
 17
17 -
 18
18 -
 19
19 -
 20
20 -
 21
21 -
 22
22 -
 23
23 -
 24
24 -
 25
25 -
 26
26 -
 27
27 -
 28
28 -
 29
29 -
 30
30 -
 31
31 -
 32
32 -
 33
33 -
 34
34 -
 35
35 -
 36
36 -
37
-
38
-
39
-
40
-
41
-
42
-
43
-
44
-
45
-
46
-
47
-
48
-
49
-
50
-
51
-
52
-
53
-
54
-
55
-
56
-
57
-
58
-
59
-
60
-
61
-
62
-
63
 |
 |
25
Report on Operations – Analysis of the Financial Position and Operating Results of the Fiat Group and Fiat S.p.A.
The operating income reported for the fiscal year, results from
the combination of positive and negative factors.
The positive factors include, other than healthy demand in
most of the Group’s markets, the introduction of new models
of Fiat Auto and Iveco and a significant reduction in product
costs made possible by programs implemented to make
industrial processes more efficient, cut production costs and
lower overhead, which was specifically targeted by the Nova
Project mentioned above.
The main negative factors were: continued intense price
competition in the Group’s principal markets, a persistent
crisis affecting the economies of the Mercosur countries (Fiat
Auto); and weak demand in North America (CNH).
However, owing in part to the introduction of new models,
there were signs of a turnaround in the fourth quarter, with
improved prices and lower discounts.
Several extraordinary income items, including the proceeds from
certain asset sales, were concentrated in the last part of the year.
The operating performance of the individual Sectors is
reviewed below:
❚Fiat Auto reported an operating loss of 121 million euros in
1999, which was slightly larger (loss of 108 million euros in
1998). However, while operating margins were under pressure
during the first part of the year, the Sector posted a markedly
improved performance during the last quarter of the year.
The return on sales was a negative 0.5%, about the same
as in the previous fiscal year.
❚Iveco‘s operating income totaled 311 million euros, for an
annual gain of 50 million euros. The return on sales also
increased, rising from 3.9% in 1998 to 4.2% in 1999, as
the Sector increased its unit sales and reduced overhead
and product costs.
❚CNH reported operating income of 371 million euros, or 81
million euros less than in the previous fiscal year. Over the
same period, the return on sales fell from 8.8% to 7.1%.
These figures do not reflect Case’s contribution, which will
be consolidated in 2000 for the first time.
The level of profitability, while still good, declined due to
difficulties encountered in the North American markets,
where the Sector was negatively affected by lower unit
sales and an unfavorable product mix.
The other industrial Sectors performed particularly well,
with total operating income reaching 349 million euros,
or 99% more than the 175 million euros reported in 1998.
The aggregate return on sales improved from 2.3% in 1998
to 3.8% in 1999.
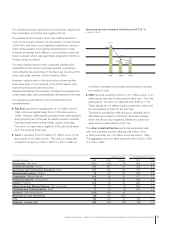
Operating Income % ROS Industrial Activities
(in millions of euros) 1999 1998 Change 1999 1998
Automobiles (Fiat Auto) (121) (108) (13) (0.5) (0.4)
Commercial Vehicles (Iveco) 311 261 50 4.2 3.9
Agricultural and Construction Equipment (CNH) 371 452 (81) 7.1 8.8
Metallurgical Products (Teksid) 76 42 34 4.5 3.6
Components (Magneti Marelli) 108 56 52 2.7 1.5
Production Systems (Comau/Pico) 43 (1) 44 2.5 (0.1)
Aviation (FiatAvio) 109 60 49 8.0 4.4
Rolling Stock and Railway Systems (Fiat Ferroviaria) 13 18 (5) 3.5 4.6
Publishing and Communications (Itedi) 17 19 (2) 4.1 4.3
Insurance (Toro Assicurazioni) (103) (168) 65 ––
Miscellaneous and eliminations (36) 115 (151) ––
Total 788 746 42 1.6 1.6
Industrial Activities only850946(96)1.92.2
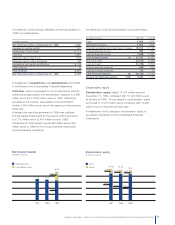
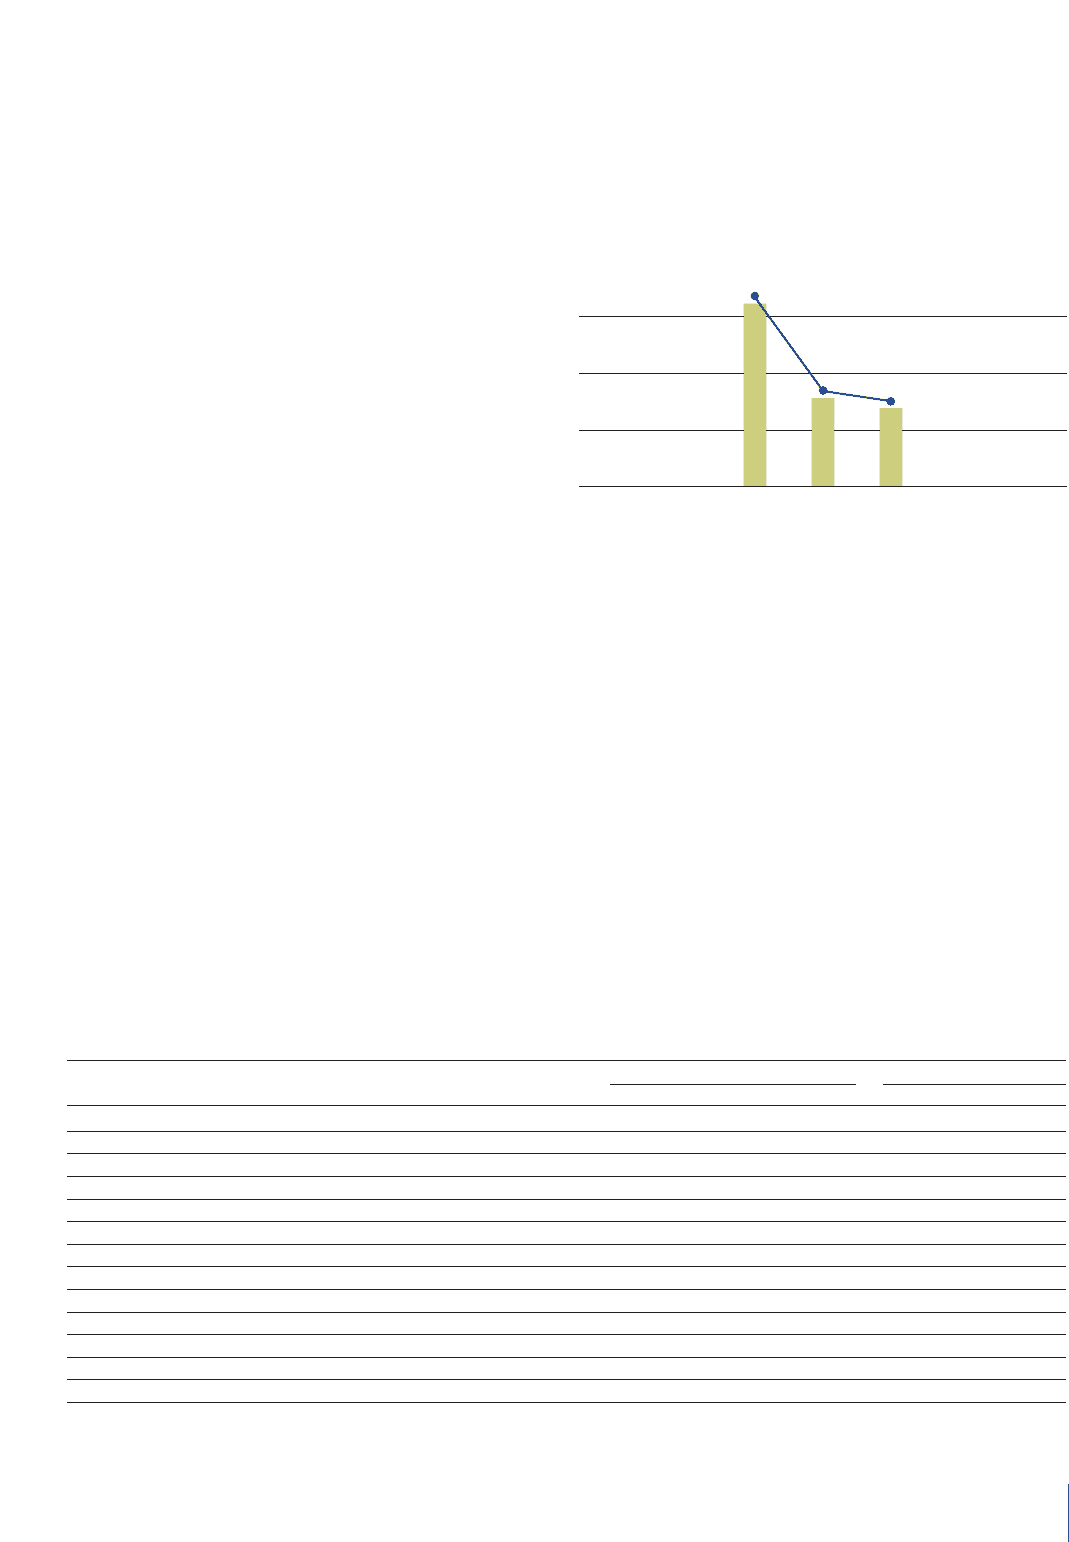
Operating Income Industrial Activities and R.O.S. %
(in millions of euros)
199919981997
1,924
4.4%
946
2.2%
850
1.9%