Chrysler 1999 Annual Report Download - page 3
Download and view the complete annual report
Please find page 3 of the 1999 Chrysler annual report below. You can navigate through the pages in the report by either clicking on the pages listed below, or by using the keyword search tool below to find specific information within the annual report.-
 1
1 -
 2
2 -
 3
3 -
 4
4 -
 5
5 -
 6
6 -
 7
7 -
 8
8 -
 9
9 -
 10
10 -
 11
11 -
 12
12 -
 13
13 -
 14
14 -
15
-
16
-
17
-
18
-
19
-
20
-
21
-
22
-
23
-
24
-
25
-
26
-
27
-
28
-
29
-
30
-
31
-
32
-
33
-
34
-
35
-
36
-
37
-
38
-
39
-
40
-
41
-
42
-
43
-
44
-
45
-
46
-
47
-
48
-
49
-
50
-
51
-
52
-
53
-
54
-
55
-
56
-
57
-
58
-
59
-
60
-
61
-
62
-
63
 |
 |
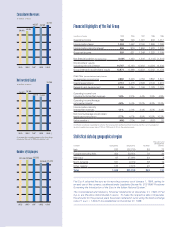
in millions of euros 1999 1998 1997 1996 1995
Operating income 788 746 1,791 932 1,717
Income before taxes 1,024 1,442 2,160 1,965 1,758
Income before minority interest 506 916 1,550 1,420 1,329
Group net income 353 621 1,248 1,225 1,109
Net financial position (Net borrowings) (4,031) 1,420 1,340 (1,142) (1,341)
Stockholders’ equity
including minority interest
14,767 15,120 15,462 14,026 13,236
Group interest in stockholders’ equity 12,874 12,998 13,203 12,042 11,178
Cash flow (income before minority interest
plus depreciation and amortization) 2,860 3,226 4,184 3,867 3,501
Capital expenditures 2,712 2,418 2,398 2,746 2,918
Research and development 1,406 1,264 1,166 1,129 1,079
Operating income from
Industrial Activities/Net revenues 1.9% 2.2% 4.4% 2.9% 4.8%
Operating income/Average
net invested capital 4.8% 5.4% 12.2% 6.3% 12.3%
Income before minority
interest/Net revenues 1.1% 2.0% 3.4% 3.5% 3.4%
Net income/Average stockholders’
equity (after minority interest) 2.7% 4.7% 9.9% 10.5% 10.3%
Value creation (*) (480) (714) 144 (607) 26
(*) Difference between operating income for the fiscal year (including investment income) and the cost of average net
invested capital at an annual rate of 10% in 1999, and of 12% in the previous years.
Financial Highlights of the Fiat Group
Fiat S.p.A. adopted the euro as its reporting currency as of January 1, 1999, opting for
an early use of this currency, as allowed under Legislative Decree No. 213/1998 “Provisions
Governing the Introduction of the Euro in the Italian National System.”
The Consolidated and Statutory Financial Statements at December 31, 1999 of Fiat
S.p.A. are therefore denominated in euros. To make the respective data comparable,
the amounts for the previous years have been restated in euros using the fixed exchange
rate of 1 euro = 1,936.27 lire established on December 31, 1998.
Research and
development
number Companies Employees Facilities Centers
Italy 233 122,730 83 72
Europe excluding Italy 454 53,654 79 34
Mercosur 67 27,883 24 9
North America 161 9,379 38 12
Other regions 133 7,673 25 4
Total 1,048 221,319 249 131
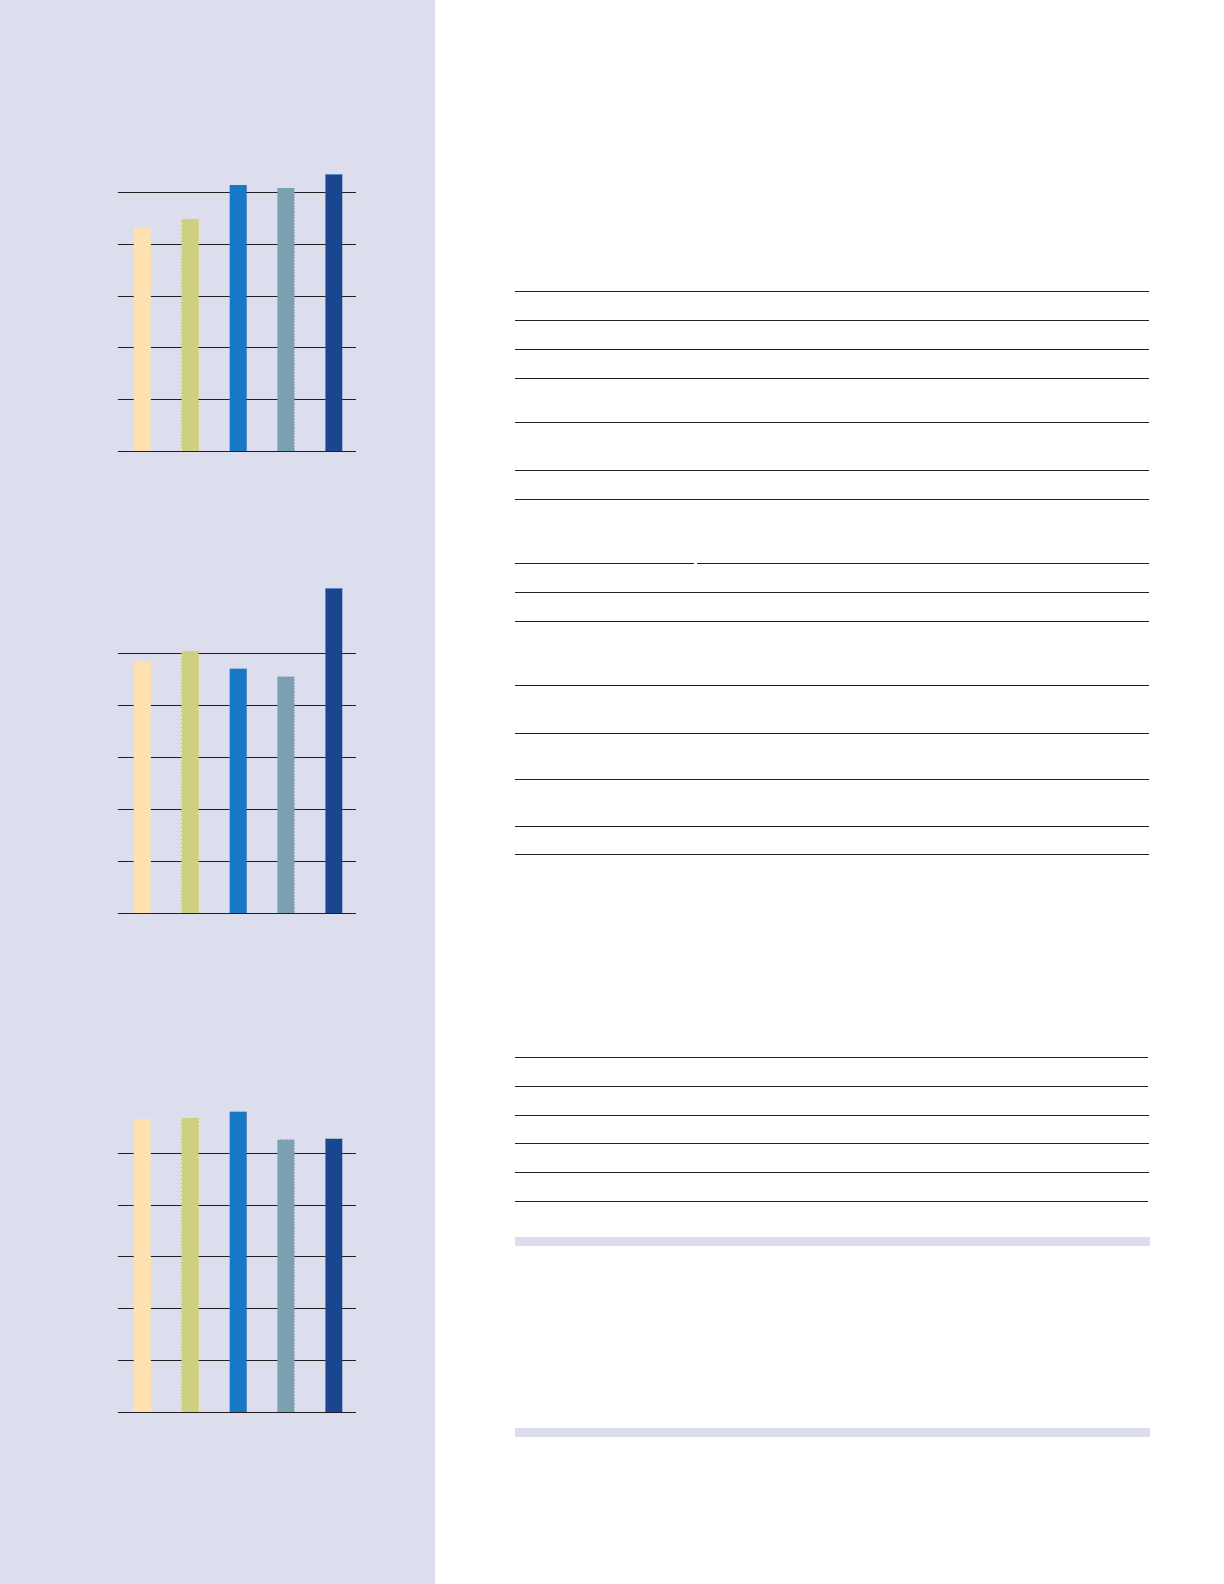
Statistical data by geographical region
1997
242,322
1998
220,549
1999
221,319
237,865
19961995
237,426
Number of Employees
Net Invested Capital
in millions of euros
1997
14,122
1998
13,700
1999 (*)
18,798
15,168
1996
14,577
1995
(*) Includes the controlling interest in the Case Group
acquired at the end of 1999 and valued at cost.
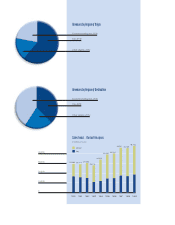
48,123
1999
45,769
1998
46,257
1997
40,244
1996
39,092
1995
Consolidated Revenues
in millions of euros