CarMax 2014 Annual Report Download - page 74
Download and view the complete annual report
Please find page 74 of the 2014 CarMax annual report below. You can navigate through the pages in the report by either clicking on the pages listed below, or by using the keyword search tool below to find specific information within the annual report.-
 1
1 -
2
-
3
-
4
-
5
-
6
-
7
-
8
-
9
-
10
-
11
-
12
-
13
-
14
-
15
-
16
-
17
-
18
-
19
-
20
-
21
-
22
-
23
-
24
-
25
-
26
-
27
-
28
-
29
-
30
-
31
-
32
-
33
-
34
-
35
-
36
-
37
-
38
-
39
-
40
-
41
-
42
-
43
-
44
-
45
-
46
-
47
-
48
-
49
-
50
-
51
-
52
-
53
-
54
-
55
-
56
-
57
-
58
-
59
-
60
-
61
-
62
-
63
-
 64
64 -
 65
65 -
 66
66 -
 67
67 -
 68
68 -
 69
69 -
 70
70 -
 71
71 -
 72
72 -
 73
73 -
 74
74 -
 75
75 -
 76
76 -
 77
77 -
 78
78 -
 79
79 -
 80
80 -
 81
81 -
 82
82 -
 83
83 -
 84
84 -
85
-
86
-
87
-
88
-
89
-
90
-
91
-
92
 |
 |

70
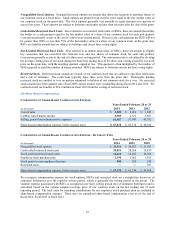
We granted 237,660 MSUs in fiscal 2014, 348,551 MSUs in fiscal 2013 and 299,102 MSUs in fiscal 2012. The
weighted average fair value per MSU at the date of grant was $52.02 in fiscal 2014, $40.33 in fiscal 2013 and
$45.48 in fiscal 2012. The fair values were determined using a Monte-Carlo simulation and were based on the
expected market price of our common stock on the vesting date and the expected number of converted common
shares. We realized related tax benefits of $7.9 million during fiscal 2014, from the vesting of market stock units.
The unrecognized compensation costs related to nonvested MSUs totaled $13.4 million as of February 28, 2014.
These costs are expected to be recognized on a straight-line basis over a weighted average period of 1.0 years.
(E) Employee Stock Purchase Plan
We sponsor an employee stock purchase plan for all associates meeting certain eligibility criteria. Associate
contributions are limited to 10% of eligible compensation, up to a maximum of $7,500 per year. For each $1.00
contributed to the plan by associates, we match $0.15. We have authorized up to 8,000,000 shares of common stock
for the employee stock purchase plan. Shares are acquired through open-market purchases.
As of February 28, 2014, a total of 3,724,673 shares remained available under the plan. Shares purchased in the
open market on behalf of associates totaled 188,797 during fiscal 2014, 251,667 during fiscal 2013 and 260,927
during fiscal 2012. The average price per share for purchases under the plan was $47.35 in fiscal 2014, $32.05 in
fiscal 2013 and $30.02 in fiscal 2012. The total costs for matching contributions are included in share-based
compensation expense.
13. NET EARNINGS PER SHARE
Nonvested share-based payment awards that contain nonforfeitable rights to dividends or dividend equivalents
(whether paid or unpaid) are participating securities and should be included in the computation of net earnings per
share pursuant to the two-class method as discussed in Note 2(X). Our restricted stock awards are considered
participating securities because they contain nonforfeitable rights to dividends and are included in the computation
of net earnings per share pursuant to the two-class method. Nonvested MSUs do not receive nonforfeitable dividend
equivalent rights, and therefore, are not considered participating securities. RSUs are nonparticipating, non-equity
instruments, and therefore, are excluded from net earnings per share calculations. There were no outstanding
participating securities during fiscal 2014 and 2013.
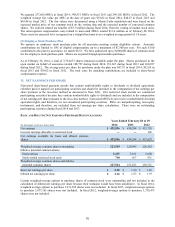
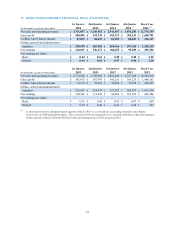
BASIC AND DILUTIVE NET EARNINGS PER SHARE RECONCILIATIONS
Years Ended February 28 or 29
(In thousands except per share data) 2014 2013 2012
N
et earnings $ 492,586 $ 434,284 $ 413,795
Less net earnings allocable to restricted stock ― ― 166
N
et earnings available for basic and diluted common
shares $ 492,586 $ 434,284 $ 413,629
Weighted average common shares outstanding 223,589 228,095 226,282
Dilutive potential common shares:
Stock options 3,255 3,161 3,608
Stock-settled restricted stock units 740 567 831
Weighted average common shares and dilutive
potential common shares 227,584 231,823 230,721
Basic net earnings per share $ 2.20 $ 1.90 $ 1.83
Diluted net earnings per share $ 2.16
$ 1.87 $ 1.79
Certain weighted-average options to purchase shares of common stock were outstanding and not included in the
calculation of diluted net earnings per share because their inclusion would have been antidilutive. In fiscal 2014,
weighted average options to purchase 1,231,382 shares were not included. In fiscal 2013, weighted-average options
to purchase 3,877,165 shares were not included. In fiscal 2012, weighted-average options to purchase 1,750,473
shares were not included.