CarMax 2014 Annual Report Download - page 46
Download and view the complete annual report
Please find page 46 of the 2014 CarMax annual report below. You can navigate through the pages in the report by either clicking on the pages listed below, or by using the keyword search tool below to find specific information within the annual report.-
 1
1 -
2
-
3
-
4
-
5
-
6
-
7
-
8
-
9
-
10
-
11
-
12
-
13
-
14
-
15
-
16
-
17
-
18
-
19
-
20
-
21
-
22
-
23
-
24
-
25
-
26
-
27
-
28
-
29
-
30
-
31
-
32
-
33
-
34
-
35
-
 36
36 -
 37
37 -
 38
38 -
 39
39 -
 40
40 -
 41
41 -
 42
42 -
 43
43 -
 44
44 -
 45
45 -
 46
46 -
 47
47 -
 48
48 -
 49
49 -
 50
50 -
 51
51 -
 52
52 -
 53
53 -
 54
54 -
 55
55 -
 56
56 -
57
-
58
-
59
-
60
-
61
-
62
-
63
-
64
-
65
-
66
-
67
-
68
-
69
-
70
-
71
-
72
-
73
-
74
-
75
-
76
-
77
-
78
-
79
-
80
-
81
-
82
-
83
-
84
-
85
-
86
-
87
-
88
-
89
-
90
-
91
-
92
 |
 |

42
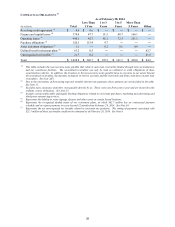
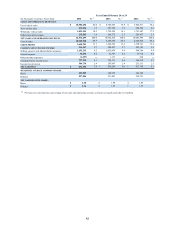
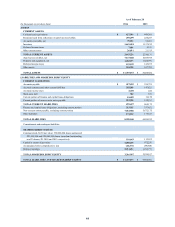
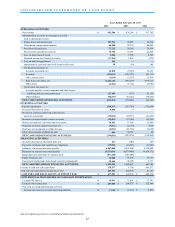
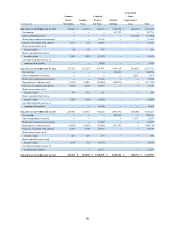
Years Ended February 28 or 29
(In thousands except per share data) 2014 % (1) 2013 % (1) 2012 % (1)
SALES AND OPERATING REVENUES:
Used vehicle sales $ 10,306,256 82.0 $ 8,746,965 79.8 $ 7,826,911 78.2
N
ew vehicle sales 212,036 1.7 207,726 1.9 200,584 2.0
Wholesale vehicle sales 1,823,425
14.5 1,759,555 16.1 1,721,647 17.2
Other sales and revenues 232,582 1.8 248,572 2.3 254,457 2.5
NET SALES AND OPERATING REVENUES 12,574,299
100.0 10,962,818 100.0 10,003,599 100.0
Cost of sales 10,925,598 86.9 9,498,456 86.6 8,624,838 86.2
GROSS PROFIT 1,648,701
13.1 1,464,362 13.4 1,378,761 13.8
CARMAX AUTO FINANCE INCOME 336,167 2.7 299,267 2.7 262,185 2.6
Selling, general and administrative expenses 1,155,215
9.2 1,031,034 9.4 940,786 9.4
Interest expense 30,834 0.2 32,357 0.3 33,714 0.3
Other income (expense) (1,497) ― 1,113 ― 464 ―
Earnings before income taxes 797,322 6.3 701,351 6.4 666,910 6.7
Income tax provision 304,736
2.4 267,067 2.4 253,115 2.5
NET EARNINGS $ 492,586 3.9 $ 434,284 4.0 $ 413,795 4.1
WEIGHTED AVERAGE COMMON SHARES:
Basic 223,589 228,095 226,282
Diluted 227,584 231,823 230,721
NET EARNINGS PER SHARE:
Basic $ 2.20 $ 1.90 $ 1.83
Diluted $ 2.16 $ 1.87 $ 1.79
(1) Percents are calculated as a percentage of net sales and operating revenues and may not equal totals due to rounding.