CarMax 2014 Annual Report Download - page 2
Download and view the complete annual report
Please find page 2 of the 2014 CarMax annual report below. You can navigate through the pages in the report by either clicking on the pages listed below, or by using the keyword search tool below to find specific information within the annual report.-
 1
1 -
 2
2 -
 3
3 -
 4
4 -
 5
5 -
 6
6 -
 7
7 -
 8
8 -
 9
9 -
 10
10 -
 11
11 -
 12
12 -
 13
13 -
14
-
15
-
16
-
17
-
18
-
19
-
20
-
21
-
22
-
23
-
24
-
25
-
26
-
27
-
28
-
29
-
30
-
31
-
32
-
33
-
34
-
35
-
36
-
37
-
38
-
39
-
40
-
41
-
42
-
43
-
44
-
45
-
46
-
47
-
48
-
49
-
50
-
51
-
52
-
53
-
54
-
55
-
56
-
57
-
58
-
59
-
60
-
61
-
62
-
63
-
64
-
65
-
66
-
67
-
68
-
69
-
70
-
71
-
72
-
73
-
74
-
75
-
76
-
77
-
78
-
79
-
80
-
81
-
82
-
83
-
84
-
85
-
86
-
87
-
88
-
89
-
90
-
91
-
92
 |
 |
ALABAMA
Birmingham
Dothan*
Huntsville
ARIZONA
Phoenix (2)
Tucson
CALIFORNIA
Bakersfield
Fresno
Los Angeles (10)
Sacramento (4)
San Diego (2)
COLORADO
Colorado Springs
Denver (2)
CONNECTICUT
Hartford /New Haven (2)
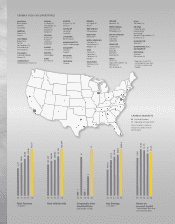
CARMAX USED CAR SUPERSTORES
FLORIDA
Ft. Myers (2)
Jacksonville (2)
Miami (5)
Orlando (2)
Tampa (2)
GEORGIA
Atlanta (5)
Augusta
Columbus
Savannah
ILLINOIS
Chicago (8)
INDIANA
Indianapolis
IOWA
Des Moines
NEVADA
Las Vegas (2)
Reno*
NEW MEXICO
Albuquerque
NEW YORK
Rochester*
NORTH CAROLINA
Charlotte (4)
Greensboro (2)
Raleigh* (3)
OHIO
Cincinnati
Cleveland*
Columbus (2)
Dayton
OKLAHOMA
Oklahoma City
Tulsa
KANSAS
Kansas City (2)
Wichita
KENTUCKY
Lexington
Louisville
LOUISIANA
Baton Rouge
MASSACHUSETTS
North Attleborough
MISSISSIPPI
Jackson
Tupelo*
MISSOURI
St. Louis (2)
NEBRASKA
Omaha
OREGON
Portland* (2)
PENNSYLVANIA
Lancaster* (2)
Philadelphia (2)
SOUTH CAROLINA
Charleston
Columbia
Greenville
TENNESSEE
Chattanooga
Jackson
Knoxville
Memphis
Nashville (3)
TEXAS
Austin (2)
Dallas / Fort Worth* (5)
Houston (5)
San Antonio (2)
UTAH
Salt Lake City
VIRGINIA
Charlottesville
Harrisonburg
Lynchburg*
Norfolk / Virginia Beach (2)
Richmond (2)
WASHINGTON
Spokane*
WASHINGTON, D.C. /
BALTIMORE (9)
WISCONSIN
Madison*
Milwaukee (2)
* Opening in fiscal 2015
(including one store each
in Dallas, Lancaster and
Raleigh)
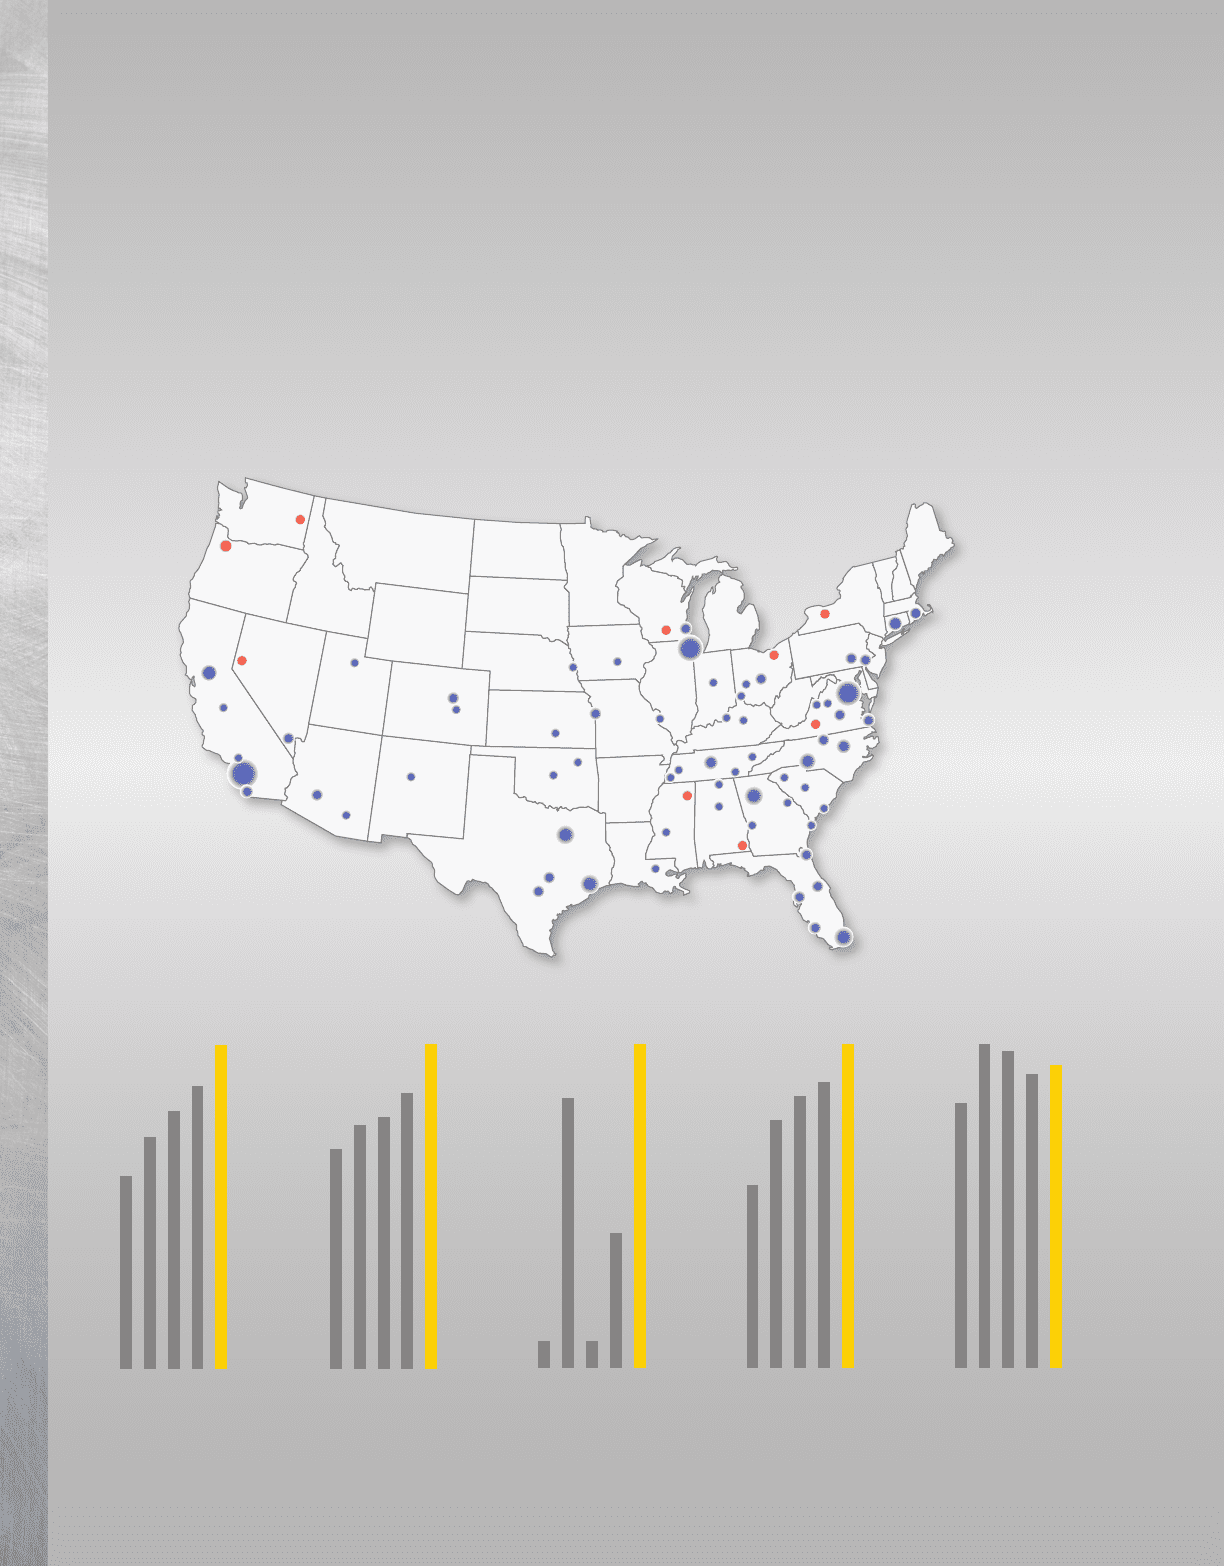
1413121110
Total Revenues
(in billions)
$10.00
$10.96
$12.57
$7.47
$8.98
1413121110
357,129
447,728
526,929
408,080
396,181
Used Vehicles Sold
1413121110
$277.8
$434.3
$492.6
$413.8
Net Earnings
(in millions)
$377.5
Return on
Invested Capital
(unleveraged, excluding
non-recourse debt)
1413121110
1413121110
11.8%
13.1%
13.5%
14.1%
14.4%
10
12
5
1
1
Comparable Store
Used Unit Sales
(percentage change)
CARMAX MARKETS
` Existing Markets
` Opening in Fiscal 2015
(Size of markers is based on
number of CarMax stores in
each market)