CarMax 2014 Annual Report Download - page 38
Download and view the complete annual report
Please find page 38 of the 2014 CarMax annual report below. You can navigate through the pages in the report by either clicking on the pages listed below, or by using the keyword search tool below to find specific information within the annual report.-
 1
1 -
2
-
3
-
4
-
5
-
6
-
7
-
8
-
9
-
10
-
11
-
12
-
13
-
14
-
15
-
16
-
17
-
18
-
19
-
20
-
21
-
22
-
23
-
24
-
25
-
26
-
27
-
 28
28 -
 29
29 -
 30
30 -
 31
31 -
 32
32 -
 33
33 -
 34
34 -
 35
35 -
 36
36 -
 37
37 -
 38
38 -
 39
39 -
 40
40 -
 41
41 -
 42
42 -
 43
43 -
 44
44 -
 45
45 -
 46
46 -
 47
47 -
 48
48 -
49
-
50
-
51
-
52
-
53
-
54
-
55
-
56
-
57
-
58
-
59
-
60
-
61
-
62
-
63
-
64
-
65
-
66
-
67
-
68
-
69
-
70
-
71
-
72
-
73
-
74
-
75
-
76
-
77
-
78
-
79
-
80
-
81
-
82
-
83
-
84
-
85
-
86
-
87
-
88
-
89
-
90
-
91
-
92
 |
 |

34
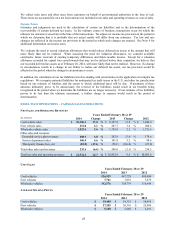
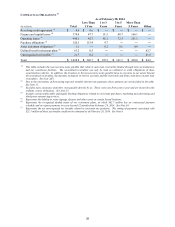
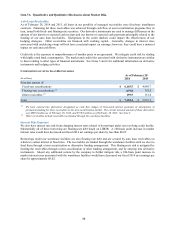
PAST DUE ACCOUNT INFORMATION
As of February 28 or 29
(In millions) 2014 2013 2012
Accounts 31+ days past due $ 185.2 $ 154.2 $ 116.5
Ending managed receivables $ 7,184.4 $ 5,933.3 $ 4,981.8
Past due accounts as a percentage of ending managed
receivables 2.58 % 2.60 % 2.34 %
CREDIT LOSS INFORMATION
Years Ended February 28 or 29
(In millions) 2014 2013 2012
N
et credit losses on managed receivables $ 59.6 $ 42.2 $ 32.0
Total average managed receivables $ 6,629.5 $ 5,385.5 $ 4,662.4
N
et credit losses as a percentage of total average
managed receivables 0.90 % 0.78 % 0.69 %
Average recovery rate 55.2 % 58.4 %
59.7 %
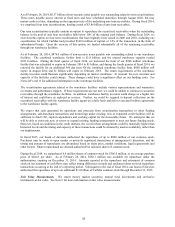
As of February 28, 2014, past due accounts were 2.58% of ending managed receivables, consistent with the 2.60%
delinquency rate as of February 28, 2013. Net credit losses increased to 0.90% of average managed receivables in
fiscal 2014 from 0.78% in fiscal 2013.
The average recovery rate represents the average percentage of the outstanding principal balance we receive when a
vehicle is repossessed and liquidated, generally at our wholesale auctions. The annual recovery rate has ranged from
a low of 42% to a high of 60%, and it is primarily affected by changes in the wholesale market pricing environment.
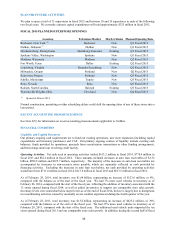
Loan Origination Test. In January 2014, CAF launched a test originating loans for customers who typically would
be financed by our subprime providers. We plan to originate approximately $70 million of loans in this test, of
which $9.1 million was originated in fiscal 2014. We expect the loans originated in this test will have higher loss
and delinquency rates than the aggregate of the current CAF portfolio. The test will be funded separately from our
current portfolio and not included in our current securitization program.
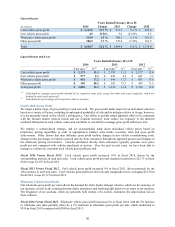
Fiscal 2013 Versus Fiscal 2012. CAF income increased 14% to $299.3 million from $262.2 million in fiscal 2012,
primarily reflecting the growth in managed receivables. Despite the growth in our receivables, direct expenses
decreased modestly as we benefited from operating efficiencies.
CAF’s average managed receivables increased 16% to $5.39 billion in fiscal 2013, driven by the growth in CAF
origination volume throughout fiscal 2012 and fiscal 2013. Origination volumes benefited from an increase in
CAF’s loan penetration rate; increased average retail selling prices, which translated into an increase in the average
amount financed; and the growth in retail unit sales. Additionally, historically low funding costs allowed CAF to
begin offering more compelling credit offers in the second half of fiscal 2013. Positive customer response to these
credit offers further bolstered CAF origination volumes.
Total interest margin was 7.4% of average managed receivables in fiscal 2013, similar to the 7.3% interest margin in
fiscal 2012.
In fiscal 2013, the provision for loan losses as a percentage of average managed receivables increased moderately to
1.04% compared with 0.78% in fiscal 2012. Low unit charge-offs and strong recovery rates continued to partially
offset the effect of the change in credit mix resulting from the transition in our origination strategy. The allowance
for loan losses increased to 0.97% of ending managed receivables as of February 28, 2013, versus 0.87% as of
February 29, 2012.