CarMax 2014 Annual Report Download - page 49
Download and view the complete annual report
Please find page 49 of the 2014 CarMax annual report below. You can navigate through the pages in the report by either clicking on the pages listed below, or by using the keyword search tool below to find specific information within the annual report.-
 1
1 -
2
-
3
-
4
-
5
-
6
-
7
-
8
-
9
-
10
-
11
-
12
-
13
-
14
-
15
-
16
-
17
-
18
-
19
-
20
-
21
-
22
-
23
-
24
-
25
-
26
-
27
-
28
-
29
-
30
-
31
-
32
-
33
-
34
-
35
-
36
-
37
-
38
-
 39
39 -
 40
40 -
 41
41 -
 42
42 -
 43
43 -
 44
44 -
 45
45 -
 46
46 -
 47
47 -
 48
48 -
 49
49 -
 50
50 -
 51
51 -
 52
52 -
 53
53 -
 54
54 -
 55
55 -
 56
56 -
 57
57 -
 58
58 -
 59
59 -
60
-
61
-
62
-
63
-
64
-
65
-
66
-
67
-
68
-
69
-
70
-
71
-
72
-
73
-
74
-
75
-
76
-
77
-
78
-
79
-
80
-
81
-
82
-
83
-
84
-
85
-
86
-
87
-
88
-
89
-
90
-
91
-
92
 |
 |

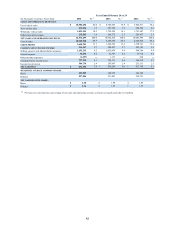
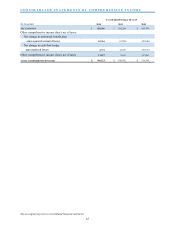
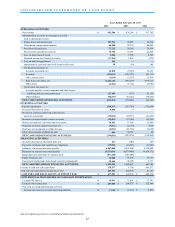
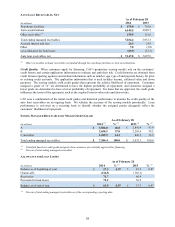
CONSOLIDATED STATEMENTS OF CASH FLOWS
See accompanying notes to consolidated financial statements.
45
Years Ended February 28 or 29
2014 2013 2012
OPERATING ACTIVITIES:
Net earnings $ 492,586 $ 434,284 $ 413,795
Adjustments to reconcile net earnings to net cash
used in operating activities:
Depreciation and amortization 101,911 95,283 82,812
Share-based compensation expense 66,480
62,112 48,089
Provision for loan losses 72,212 56,168 36,439
Provision for cancellation reserves 76,746
31,667 22,840
Loss on disposition of assets 2,268 1,995 2,569
Deferred income tax (benefit) provision (17,185) 3,858 (872)
Loss on debt extinguishment 389 ― ―
Impairment of (gain on) long-lived assets held for sale 50
(50) 248
Net decrease (increase) in:
Accounts receivable, net 12,038
(5,527) 33,163
Inventory (123,611) (425,221) (43,115)
Other current assets (3,019) (3,252) 15,919
Auto loan receivables, net (1,324,142) (992,239) (675,711)
Other assets (6,754) (1,722) (6,986)
Net increase (decrease) in:
Accounts payable, accrued expenses and other current
liabilities and accrued income taxes 117,405 (575) 43,138
Other liabilities (80,537) (35,222) (34,492)
NET CASH USED IN OPERATING ACTIVITIES (613,163) (778,441) (62,164)
INVESTING ACTIVITIES:
Capital expenditures (310,317) (235,707) (172,608)
Proceeds from sales of assets 5,095
― ―
Increase in restricted cash from collections on
auto loan receivables (35,012) (19,973) (43,262)
Increase in restricted cash in reserve accounts (10,403) (13,385) (12,364)
Release of restricted cash from reserve accounts 19,202
17,368 12,096
Purchases of money market securities, net (3,661) (2,139) (678)
Purchases of investments available-for-sale (2,051) (31,756) (2,638)
Sales of investments available-for-sale 466 30,318 52
NET CASH USED IN INVESTING ACTIVITIES (336,681) (255,274) (219,402)
FINANCING ACTIVITIES:
Increase (decrease) in short-term debt, net 227
(588) (59)
Payments on finance and capital lease obligations (19,596) (14,083) (12,560)
Issuances of non-recourse notes payable 6,907,000
5,851,000 5,130,000
Payments on non-recourse notes payable (5,513,646) (4,679,999) (4,459,572)
Repurchase and retirement of common stock (307,248) (203,405) ―
Equity issuances, net 39,000 63,396 15,577
Excess tax benefits from share-based payment arrangements 22,644
24,100 9,717
NET CASH PROVIDED BY FINANCING ACTIVITIES 1,128,381 1,040,421 683,103
Increase in cash and cash equivalents 178,537
6,706
401,537
Cash and cash equivalents at beginning of year 449,364 442,658 41,121
CASH AND CASH EQUIVALENTS AT END OF YEAR $ 627,901 $ 449,364 $ 442,658
SUPPLEMENTAL DISCLOSURES OF CASH FLOW INFORMATION
Cash paid for interest $ 30,991 $ 32,601 $ 33,741
Cash paid for income taxes $ 287,000 $ 244,337 $ 223,806
Non-cash investing and financing activities:
Increase (decrease) in accrued capital expenditures $ 11,468 $ (1,211) $ 8,859