CarMax 2014 Annual Report Download - page 33
Download and view the complete annual report
Please find page 33 of the 2014 CarMax annual report below. You can navigate through the pages in the report by either clicking on the pages listed below, or by using the keyword search tool below to find specific information within the annual report.-
 1
1 -
2
-
3
-
4
-
5
-
6
-
7
-
8
-
9
-
10
-
11
-
12
-
13
-
14
-
15
-
16
-
17
-
18
-
19
-
20
-
21
-
22
-
 23
23 -
 24
24 -
 25
25 -
 26
26 -
 27
27 -
 28
28 -
 29
29 -
 30
30 -
 31
31 -
 32
32 -
 33
33 -
 34
34 -
 35
35 -
 36
36 -
 37
37 -
 38
38 -
 39
39 -
 40
40 -
 41
41 -
 42
42 -
 43
43 -
44
-
45
-
46
-
47
-
48
-
49
-
50
-
51
-
52
-
53
-
54
-
55
-
56
-
57
-
58
-
59
-
60
-
61
-
62
-
63
-
64
-
65
-
66
-
67
-
68
-
69
-
70
-
71
-
72
-
73
-
74
-
75
-
76
-
77
-
78
-
79
-
80
-
81
-
82
-
83
-
84
-
85
-
86
-
87
-
88
-
89
-
90
-
91
-
92
 |
 |
29
selling prices had an adverse effect on our used vehicle sales in recent years. As new car industry sales return to historical
levels, the supply of late-model used vehicles should gradually improve, which we believe will benefit our business.
Our data indicated that in our markets, we increased our share of the 0- to 10-year old used vehicle market by
approximately 7% in fiscal 2013.
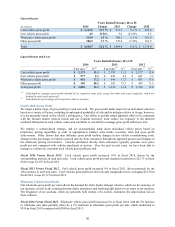
Wholesale Vehicle Sales
Our wholesale auction prices usually reflect the trends in the general wholesale market for the types of vehicles we
sell, although they can also be affected by changes in vehicle mix or the average age, mileage or condition of the
vehicles bought through our appraisal process and sold in our auctions.
Fiscal 2014 Versus Fiscal 2013. The 4% increase in wholesale vehicle revenues in fiscal 2014 resulted from a 5%
increase in wholesale unit sales, partially offset by a 2% reduction in average wholesale vehicle selling price. The
wholesale unit growth primarily reflected the growth in our store base, as well as an increase in the appraisal buy
rate. However, we experienced a reduced mix of wholesale vehicles in our appraisal traffic that partially offset the
benefit of our store growth and increased buy rate.
Fiscal 2013 Versus Fiscal 2012. The 2% increase in wholesale vehicle revenues in fiscal 2013 resulted from a 3%
increase in wholesale unit sales offset by a slight reduction in average wholesale vehicle selling price. The
wholesale unit growth included the combined effects of the growth in our store base and higher appraisal traffic,
offset by a lower appraisal buy rate. The modest growth in wholesale unit sales also reflected the challenging
comparisons with fiscal 2012 and fiscal 2011, when wholesale unit sales grew 20% and 33%, respectively.
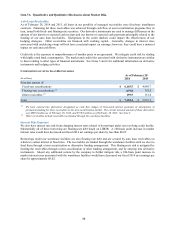
Other Sales and Revenues
Other sales and revenues include commissions on the sale of ESPs and GAP (collectively reported in ESP revenues,
net of a reserve for estimated customer cancellations), service department sales and net third-party finance fees. The
fixed, per-vehicle fees paid to us by prime and nonprime third-party finance providers may vary, reflecting the
providers’ differing levels of credit risk exposure. The fixed, per-vehicle fees that we pay to the subprime providers
are reflected as an offset to finance fee revenues received from prime and nonprime providers. In previous years,
the percentage of our retail unit sales financed by subprime providers excluded sales associated with a third-party
referral program. These sales are now included in this percentage for current and prior periods.
Fiscal 2014 Versus Fiscal 2013. Other sales and revenues declined 6% in fiscal 2014, reflecting a reduction in net
third-party finance fees and only modest growth in ESP revenue. The decrease in net third-party finance fees was
driven by a mix shift among providers, including an increase in the percentage of our retail unit sales financed by the
subprime providers to 19% in fiscal 2014 versus 16% in fiscal 2013. Throughout fiscal 2013 and for most of fiscal
2014, the volume and share of financing originated by the third-party subprime providers increased on a year-over-
year basis, as these providers made more attractive offers to customers. In the fourth quarter of fiscal 2014,
however, the subprime providers moderated their credit offerings, and as a result, their share of financings for the
fourth quarter was flat with fiscal 2013.
During fiscal 2014, we corrected our accounting related to cancellation reserves for ESP and GAP, with resulting
increases in reserves related to activity for fiscal 2014, fiscal 2013, and fiscal 2012. The portion of the increase in
reserves related to prior fiscal years totaled $19.5 million. The effect of the increase in the cancellation reserves
largely offset the growth in ESP revenues resulting from our increase in used unit sales and a higher ESP penetration
rate.
Fiscal 2013 Versus Fiscal 2012. Other sales and revenues declined 2% in fiscal 2013, as an increase in ESP
revenues was more than offset by a decrease in net third-party finance fees. ESP revenues increased 13%, primarily
reflecting the growth in our retail vehicle unit sales and an increase in ESP penetration. The decrease in net third-
party finance fees was driven by a mix shift among providers, including an increase in the percentage of our retail
unit sales financed by the subprime providers to 16% in fiscal 2013 versus 10% in fiscal 2012. The growth in the
subprime sales mix primarily resulted from more compelling credit offers being made by the subprime providers.