CarMax 2014 Annual Report Download - page 62
Download and view the complete annual report
Please find page 62 of the 2014 CarMax annual report below. You can navigate through the pages in the report by either clicking on the pages listed below, or by using the keyword search tool below to find specific information within the annual report.-
 1
1 -
2
-
3
-
4
-
5
-
6
-
7
-
8
-
9
-
10
-
11
-
12
-
13
-
14
-
15
-
16
-
17
-
18
-
19
-
20
-
21
-
22
-
23
-
24
-
25
-
26
-
27
-
28
-
29
-
30
-
31
-
32
-
33
-
34
-
35
-
36
-
37
-
38
-
39
-
40
-
41
-
42
-
43
-
44
-
45
-
46
-
47
-
48
-
49
-
50
-
51
-
 52
52 -
 53
53 -
 54
54 -
 55
55 -
 56
56 -
 57
57 -
 58
58 -
 59
59 -
 60
60 -
 61
61 -
 62
62 -
 63
63 -
 64
64 -
 65
65 -
 66
66 -
 67
67 -
 68
68 -
 69
69 -
 70
70 -
 71
71 -
 72
72 -
73
-
74
-
75
-
76
-
77
-
78
-
79
-
80
-
81
-
82
-
83
-
84
-
85
-
86
-
87
-
88
-
89
-
90
-
91
-
92
 |
 |
58
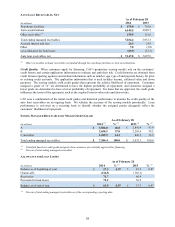
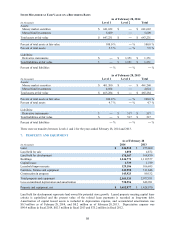
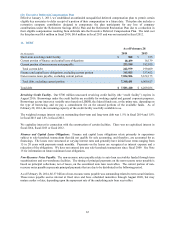
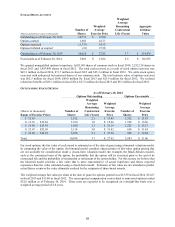
ITEMS MEASURED AT FAIR VALUE ON A RECURRING BASIS
As of February 28, 2014
(In thousands) Level 1 Level 2 Total
Assets:
Money market securities $ 641,622 $ ― $ 641,622
Mutual fund investments 5,609 ― 5,609
Total assets at fair value $ 647,231 $ ― $ 647,231
Percent of total assets at fair value 100.0 % ― % 100.0 %
Percent of total assets 5.5 % ― % 5.5 %
Liabilities:
Derivative instruments $ ― $ 1,351 $ 1,351
Total liabilities at fair value $ ― $ 1,351 $ 1,351
Percent of total liabilities ―% ― % ―%
As of February 28, 2013
(In thousands) Level 1 Level 2 Total
Assets:
Money market securities $ 461,260 $ ― $ 461,260
Mutual fund investments 4,024 ― 4,024
Total assets at fair value $ 465,284 $ ― $ 465,284
Percent of total assets at fair value 100.0 % ― % 100.0 %
Percent of total assets 4.7 % ― % 4.7 %
Liabilities:
Derivative instruments $ ― $ 517 $ 517
Total liabilities at fair value $ ― $ 517 $ 517
Percent of total liabilities ―% ― % ―%
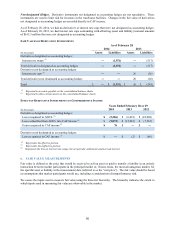
There were no transfers between Levels 1 and 2 for the years ended February 28, 2014 and 2013.
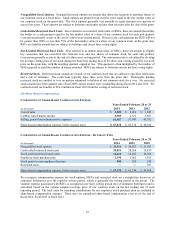
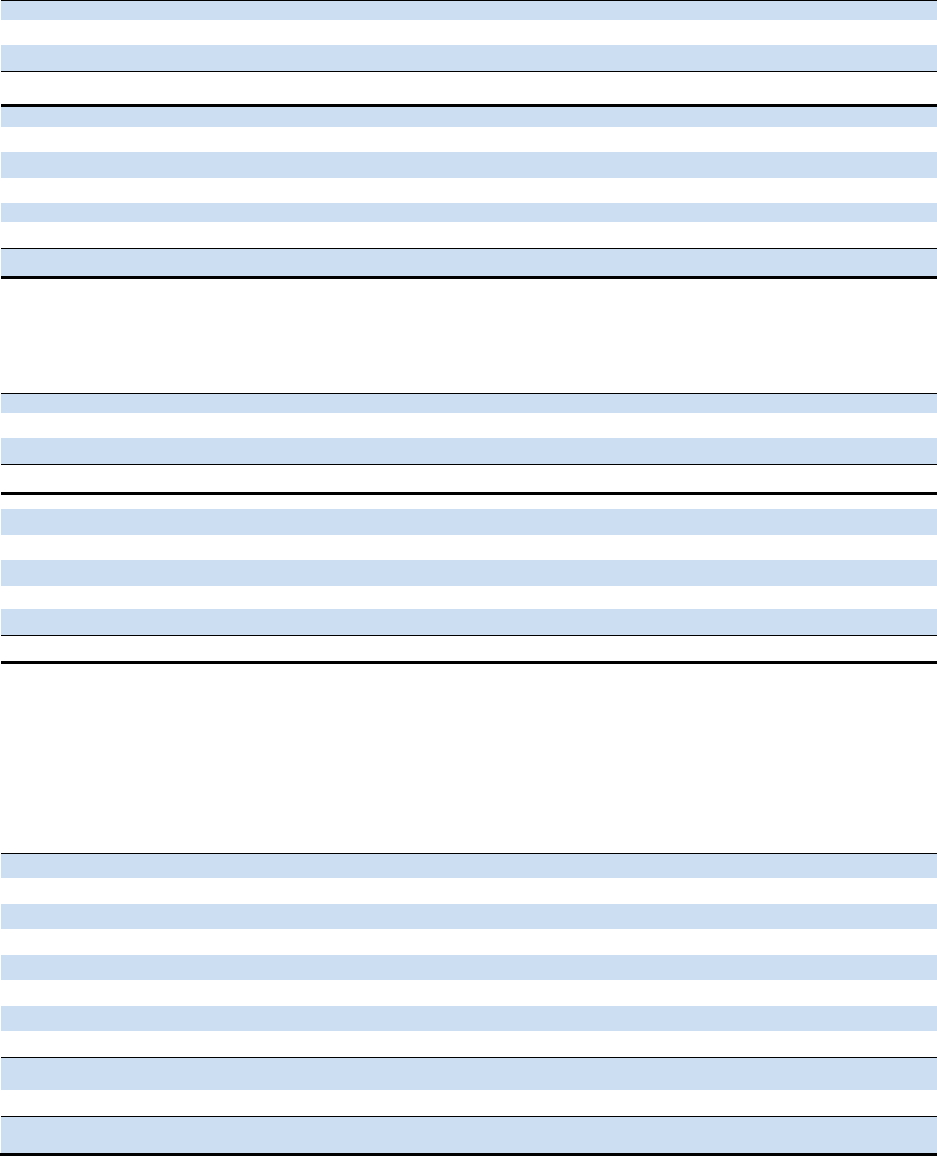
7. PROPERTY AND EQUIPMENT
As of February 28
(In thousands) 2014 2013
Land $ 346,518 $ 275,060
Land held for sale 1,050 4,872
Land held for development 170,387 168,830
Buildings 1,244,772 1,119,577
Capital leases 1,739 1,739
Leasehold improvements 129,186 106,695
Furniture, fixtures and equipment 343,958 311,646
Construction in progress 145,923 89,532
Total property and equipment 2,383,533 2,077,951
Less accumulated depreciation and amortization 730,556 648,981
Property and equipment, net $ 1,652,977 $ 1,428,970
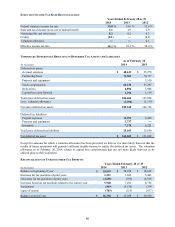
Land held for development represents land owned for potential store growth. Leased property meeting capital lease
criteria is capitalized and the present value of the related lease payments is recorded as long-term debt.
Amortization of capital leased assets is included in depreciation expense, and accumulated amortization was
$0.3 million as of February 28, 2014, and $0.2 million as of February 28, 2013. Depreciation expense was
$90.4 million in fiscal 2014, $82.3 million in fiscal 2013 and $75.2 million in fiscal 2012.