CarMax 2014 Annual Report Download - page 67
Download and view the complete annual report
Please find page 67 of the 2014 CarMax annual report below. You can navigate through the pages in the report by either clicking on the pages listed below, or by using the keyword search tool below to find specific information within the annual report.-
 1
1 -
2
-
3
-
4
-
5
-
6
-
7
-
8
-
9
-
10
-
11
-
12
-
13
-
14
-
15
-
16
-
17
-
18
-
19
-
20
-
21
-
22
-
23
-
24
-
25
-
26
-
27
-
28
-
29
-
30
-
31
-
32
-
33
-
34
-
35
-
36
-
37
-
38
-
39
-
40
-
41
-
42
-
43
-
44
-
45
-
46
-
47
-
48
-
49
-
50
-
51
-
52
-
53
-
54
-
55
-
56
-
 57
57 -
 58
58 -
 59
59 -
 60
60 -
 61
61 -
 62
62 -
 63
63 -
 64
64 -
 65
65 -
 66
66 -
 67
67 -
 68
68 -
 69
69 -
 70
70 -
 71
71 -
 72
72 -
 73
73 -
 74
74 -
 75
75 -
 76
76 -
 77
77 -
78
-
79
-
80
-
81
-
82
-
83
-
84
-
85
-
86
-
87
-
88
-
89
-
90
-
91
-
92
 |
 |

63
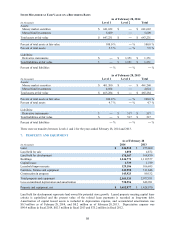
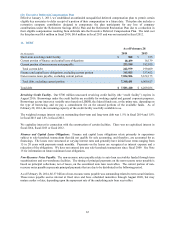
The fair values of the plan’s assets are provided by the plan’s trustee and the investment managers. Within the fair
value hierarchy (see Note 6), the mutual funds are classified as Level 1 as quoted active market prices for identical
assets are used to measure fair value. The collective funds are public investment vehicles valued using a net asset
value (“NAV”) provided by the plan’s trustee as a practical expedient for measuring the fair value. The NAV is
based on the underlying net assets owned by the fund divided by the number of shares outstanding. The NAV’s unit
price is quoted on a private market that was not active. However, the NAV is based on the fair value of the
underlying securities within the fund, which were traded on an active market and valued at the closing price reported
on the active market on which those individual securities are traded. The collective funds may be liquidated with
minimal restrictions and are classified as Level 2.
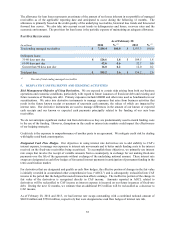
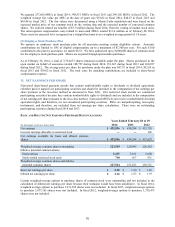
Funding Policy. For the pension plan, we contribute amounts sufficient to meet minimum funding requirements as
set forth in the employee benefit and tax laws, plus any additional amounts as we may determine to be appropriate.
We expect to contribute $4.2 million to the pension plan in fiscal 2015. For the non-funded restoration plan, we
contribute an amount equal to the benefit payments.
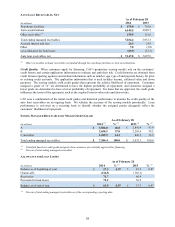
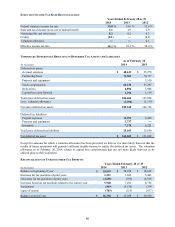
ESTIMATED FUTURE BENEFIT PAYMENTS
Pension Restoration
(In thousands) Plan Plan
Fiscal 2015 $ 2,056 $ 451
Fiscal 2016 $ 2,407 $ 466
Fiscal 2017 $ 2,726 $ 476
Fiscal 2018 $ 3,076 $ 482
Fiscal 2019 $ 3,464 $ 485
Fiscal 2020 to 2024 $ 24,182 $ 2,810
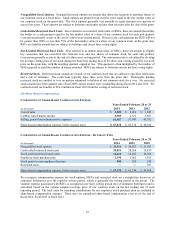
COMPONENTS OF NET PENSION EXPENSE
Years Ended February 28 or 29
(In thousands) Pension Plan Restoration Plan Total
2014 2013 2012 2014 2013 2012 2014 2013 2012
Interest cost $ 7,583 $ 7,299 $ 6,830 $ 433 $ 458 $ 518 $ 8,016 $ 7,757 $ 7,348
Expected return on
plan assets (7,916) (7,591) (6,870) ― ― ― (7,916) (7,591) (6,870)
Recognized actuarial
loss 1,674 1,200 461 ― ― ― 1,674 1,200 461
N
et pension expense $ 1,341 $ 908 $ 421 $ 433 $ 458 $ 518 $ 1,774 $ 1,366 $ 939
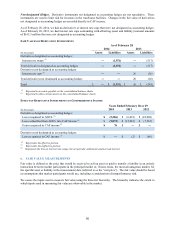
CHANGES RECOGNIZED IN ACCUMULATED OTHER COMPREHENSIVE LOSS
Years Ended February 28
Pension Plan Restoration Plan Total
(In thousands) 2014 2013 2014 2013 2014 2013
N
et actuarial (gain) loss $ (16,268) $ 17,182 $ 803 $ (488) $ (15,465) $ 16,694
In fiscal 2015, we anticipate that $1.4 million in estimated actuarial losses of the pension plan will be amortized
from accumulated other comprehensive loss. We do not anticipate that any appreciable estimated actuarial losses
will be amortized from accumulated other comprehensive loss for the restoration plan.