CarMax 2014 Annual Report Download - page 50
Download and view the complete annual report
Please find page 50 of the 2014 CarMax annual report below. You can navigate through the pages in the report by either clicking on the pages listed below, or by using the keyword search tool below to find specific information within the annual report.-
 1
1 -
2
-
3
-
4
-
5
-
6
-
7
-
8
-
9
-
10
-
11
-
12
-
13
-
14
-
15
-
16
-
17
-
18
-
19
-
20
-
21
-
22
-
23
-
24
-
25
-
26
-
27
-
28
-
29
-
30
-
31
-
32
-
33
-
34
-
35
-
36
-
37
-
38
-
39
-
 40
40 -
 41
41 -
 42
42 -
 43
43 -
 44
44 -
 45
45 -
 46
46 -
 47
47 -
 48
48 -
 49
49 -
 50
50 -
 51
51 -
 52
52 -
 53
53 -
 54
54 -
 55
55 -
 56
56 -
 57
57 -
 58
58 -
 59
59 -
 60
60 -
61
-
62
-
63
-
64
-
65
-
66
-
67
-
68
-
69
-
70
-
71
-
72
-
73
-
74
-
75
-
76
-
77
-
78
-
79
-
80
-
81
-
82
-
83
-
84
-
85
-
86
-
87
-
88
-
89
-
90
-
91
-
92
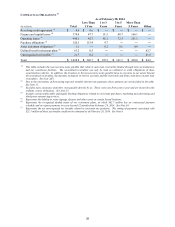
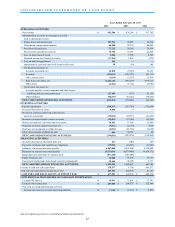
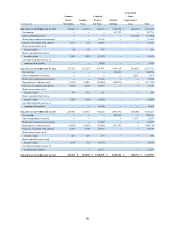
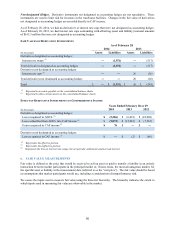
 |
 |

46
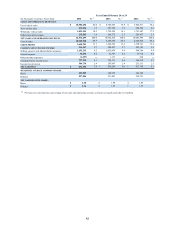
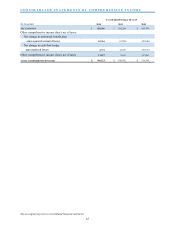
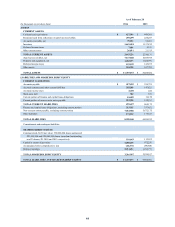
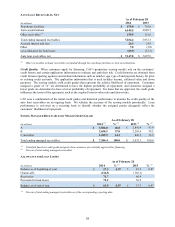
Accumulated
Common Capital in Other
Shares Common Excess of Retained Comprehensive
(In thousands) Outstanding Stock Par Value Earnings Loss Total
BALANCE AS OF FEBRUARY 28, 2011 225,886 $ 112,943 $ 820,639 $ 1,330,724 $ (25,057) $ 2,239,249
Net earnings ― ― ― 413,795 ― 413,795
Other comprehensive loss ― ― ― ― (37,402) (37,402)
Share-based compensation expense ― ― 32,105 ― ― 32,105
Exercise of common stock options 1,519 759 24,494 ― ― 25,253
Shares issued under stock
incentive plans 20 10 540 ― ― 550
Shares cancelled under stock
incentive plans (306) (153) (9,523) ― ― (9,676)
Tax effect from the exercise of
common stock options ― ― 9,238 ― ― 9,238
BALANCE AS OF FEBRUARY 29, 2012 227,119 113,559 877,493 1,744,519 (62,459) 2,673,112
Net earnings ― ― ― 434,284 ― 434,284
Other comprehensive income ― ― ― ― 2,651 2,651
Share-based compensation expense ― ― 37,294 ― ― 37,294
Repurchases of common stock (5,762) (2,881) (24,066) (185,031) ― (211,978)
Exercise of common stock options 4,016 2,008 69,737 ― ― 71,745
Shares issued under stock
incentive plans 791 395 155 ― ― 550
Shares cancelled under stock
incentive plans (258) (128) (8,221) ― ― (8,349)
Tax effect from the exercise of
common stock options ― ― 19,858 ― ― 19,858
BALANCE AS OF FEBRUARY 28, 2013 225,906 112,953 972,250 1,993,772 (59,808) 3,019,167
Net earnings ― ― ― 492,586 ― 492,586
Other comprehensive income ― ― ― ― 13,537 13,537
Share-based compensation expense ― ― 36,429 ― ― 36,429
Repurchases of common stock (6,860) (3,430) (30,566) (272,142) ― (306,138)
Exercise of common stock options 2,337 1,168 43,977 ― ― 45,145
Shares issued under stock
incentive plans 453 227 273 ― ― 500
Shares cancelled under stock
incentive plans (150) (75) (6,071) ― ― (6,146)
Tax effect from the exercise of
common stock options ― ― 21,917 ― ― 21,917
BALANCE AS OF FEBRUARY 28, 2014 221,686 $ 110,843 $ 1,038,209 $ 2,214,216 $ (46,271) $ 3,316,997