CarMax 2014 Annual Report Download - page 40
Download and view the complete annual report
Please find page 40 of the 2014 CarMax annual report below. You can navigate through the pages in the report by either clicking on the pages listed below, or by using the keyword search tool below to find specific information within the annual report.-
 1
1 -
2
-
3
-
4
-
5
-
6
-
7
-
8
-
9
-
10
-
11
-
12
-
13
-
14
-
15
-
16
-
17
-
18
-
19
-
20
-
21
-
22
-
23
-
24
-
25
-
26
-
27
-
28
-
29
-
 30
30 -
 31
31 -
 32
32 -
 33
33 -
 34
34 -
 35
35 -
 36
36 -
 37
37 -
 38
38 -
 39
39 -
 40
40 -
 41
41 -
 42
42 -
 43
43 -
 44
44 -
 45
45 -
 46
46 -
 47
47 -
 48
48 -
 49
49 -
 50
50 -
51
-
52
-
53
-
54
-
55
-
56
-
57
-
58
-
59
-
60
-
61
-
62
-
63
-
64
-
65
-
66
-
67
-
68
-
69
-
70
-
71
-
72
-
73
-
74
-
75
-
76
-
77
-
78
-
79
-
80
-
81
-
82
-
83
-
84
-
85
-
86
-
87
-
88
-
89
-
90
-
91
-
92
 |
 |

36
2013 we built inventories at a higher rate than in recent years to better position ourselves for seasonal sales
opportunities.
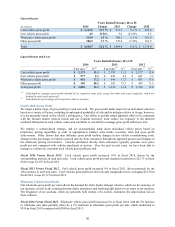
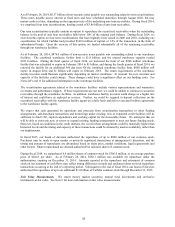
Investing Activities. Net cash used in investing activities totaled $336.7 million in fiscal 2014, $255.3 million in
fiscal 2013 and $219.4 million in fiscal 2012. Investing activities primarily consist of capital expenditures, which
totaled $310.3 million in fiscal 2014, $235.7 million in fiscal 2013 and $172.6 million in fiscal 2012. Capital
expenditures primarily include real estate acquisitions for planned future store openings and store construction costs.
We maintain a multi-year pipeline of sites to support our superstore growth, so portions of capital spending in one
year may relate to stores that we plan to open in subsequent fiscal years. The increases in capital expenditures over
the last three fiscal years primarily related to the growth in our store opening pace, as we increased store openings
from 5 in fiscal 2012, to 10 in fiscal 2013, and 13 in fiscal 2014.
Historically, capital expenditures have been funded with internally-generated funds, debt and sale-leaseback
transactions. No sale-leasebacks have been executed since fiscal 2009.
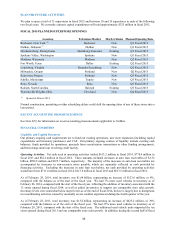
As of February 28, 2014, we owned 74 and leased 57 of our 131 used car superstores.
Restricted cash from collections on auto loan receivables increased $35.0 million in fiscal 2014, $20.0 million in
fiscal 2013 and $43.3 million in fiscal 2012. These collections vary depending on the timing of the receipt of
principal and interest payments on securitized auto loan receivables, the change in average managed receivables and
the funding vehicle utilized.
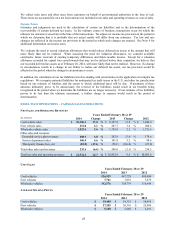
Financing Activities. Net cash provided by financing activities totaled $1.13 billion in fiscal 2014, $1.04 billion in
fiscal 2013 and $683.1 million in fiscal 2012. Included in these amounts were net increases in total non-recourse
notes payable of $1.39 billion, $1.17 billion and $670.4 million, respectively, which were used to provide the
financing for the majority of the increases of $1.32 billion, $992.2 million and $675.7 million, respectively, in auto
loan receivables. During fiscal 2014 and fiscal 2013, net cash provided by financing activities was reduced by stock
repurchases of $307.2 million, and $203.4 million, respectively.
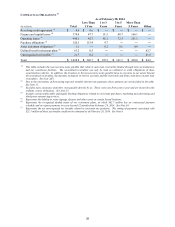
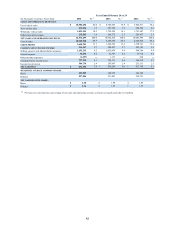
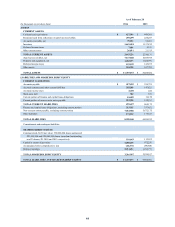
TOTAL DEBT AND CASH AND CASH EQUIVALENTS
As of February 28
(In thousands) 2014 2013
Borrowings under revolving credit facility $ 582 $ 355
Finance and capital lease obligations 334,384 353,591
N
on-recourse notes payable 7,248,444 5,855,090
Total debt $ 7,583,410 $ 6,209,036
Cash and cash equivalents $ 627,901 $ 449,364
We have a $700 million unsecured revolving credit facility, which expires in August 2016. Borrowings under this
credit facility are available for working capital and general corporate purposes, and the unused portion is fully
available to us. See Note 11 for additional information on the revolving credit facility.
The credit facility agreement contains representations and warranties, conditions and covenants. If these
requirements were not met, all amounts outstanding or otherwise owed could become due and payable immediately
and other limitations could be placed on our ability to use any available borrowing capacity.
CAF auto loan receivables are primarily funded through securitization transactions. Our securitizations are
structured to legally isolate the auto loan receivables, and we would not expect to be able to access the assets of our
securitization vehicles, even in insolvency, receivership or conservatorship proceedings. Similarly, the investors in
the non-recourse notes payable have no recourse to our assets beyond the securitized receivables, the amounts on
deposit in reserve accounts and the restricted cash from collections on auto loan receivables. We do, however,
continue to have the rights associated with the interest we retain in these securitization vehicles.
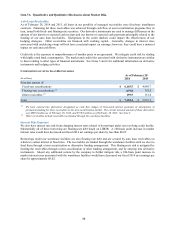
The timing of principal payments on the non-recourse notes payable is based on principal collections, net of losses,
on the securitized auto loan receivables. The current portion of non-recourse notes payable represents principal
payments that are due to be distributed in the following period.